This lesson demonstrates the Rayleigh backscattering effect in the EDFA.
The backscattering from an EDFA exceeds backscattering from an equivalent length of a non-doped fiber. Because Rayleigh backscattering can cause degradation in the EDFA performance [1], this effect has to be considered in the simulations to give better accuracy in the results. The EDF component considers the Rayleigh scattering effect in the simulations.
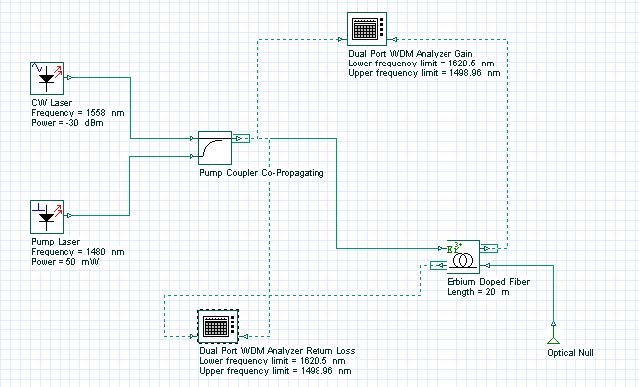
This lesson demonstrates the backscattering caused by the Rayleigh effect and the results of simulations are compared to an analytical approximation given by [2]. The system used in the simulations is shown in Figure 1.
The WDM analyzer linking the coupler output port to the output port at the right end of the erbium-doped fiber gives the return loss of the signal at 1558nm. This return loss indicates the ratio between the input signal power and the reflection power generated by the Rayleigh backscattering effect.
Figure 1: System layout used to find the return loss of the EDFA
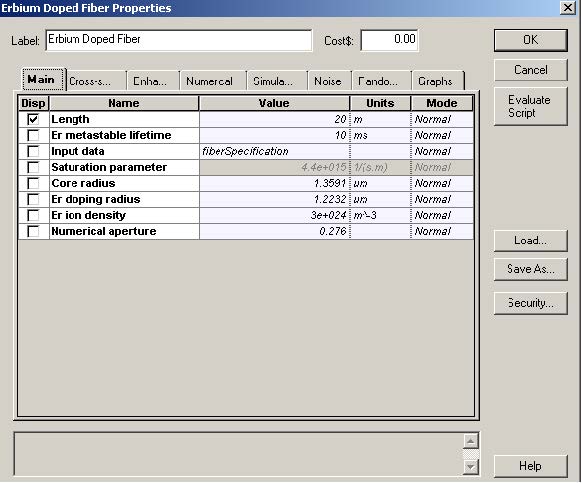
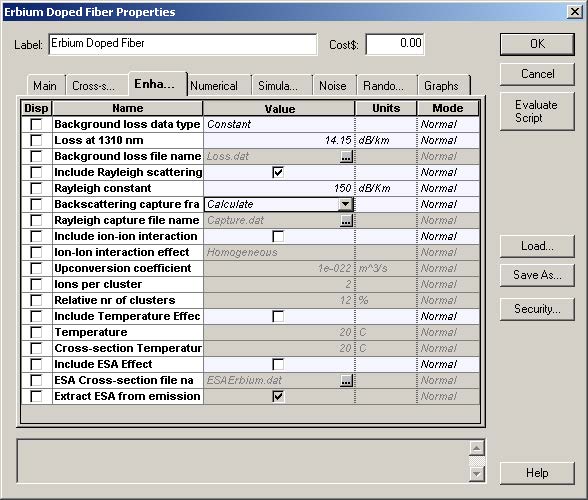
The characteristics of the EDF used in the simulations are shown in Figure 2 and Figure 3. In the enhanced tab in Figure 2, the values for the Rayleigh constant and capture fraction are defined. In the case of capture fraction, the option for the component was chosen. In this case, the value of the capture is given by the equation (25) in the technical background.
Figure 2: Erbium-doped fiber characteristics (a) Main tab and (b) Enhancement tab
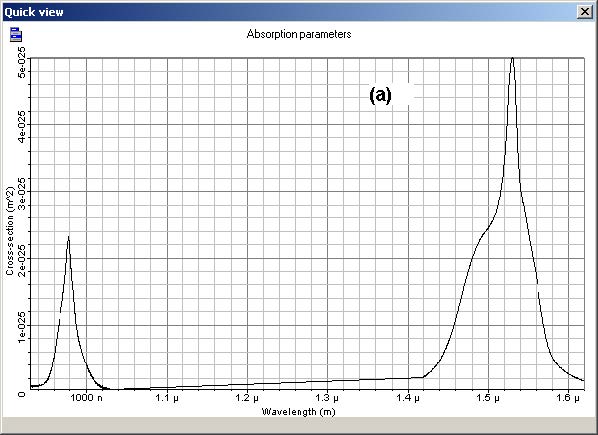
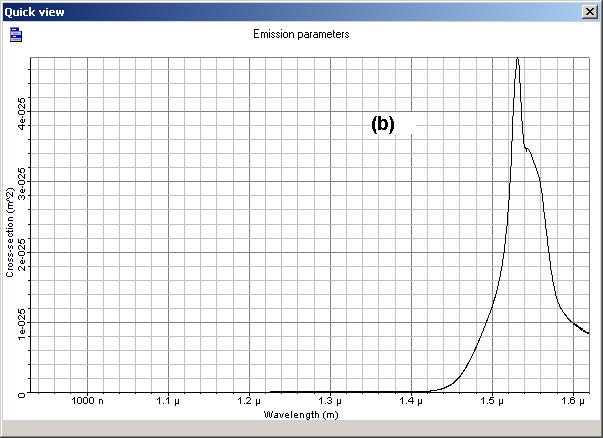
Figure 3 shows the absorption and emission cross sections of the EDF used.
Figure 3: (a) Absorption and (b) emission cross sections of the EDF
In accordance with [2], the return loss from an EDF in the presence of fiber scattering can be approximated by:

Where G is the gain of the EDFA, L is the fiber length, C is the capture fraction and αs is the background loss due to scattering.
This equation gives a reference to compare the results obtained from the simulations. However, before you calculate the return loss, it is necessary to obtain the signal gain at 1558nm.
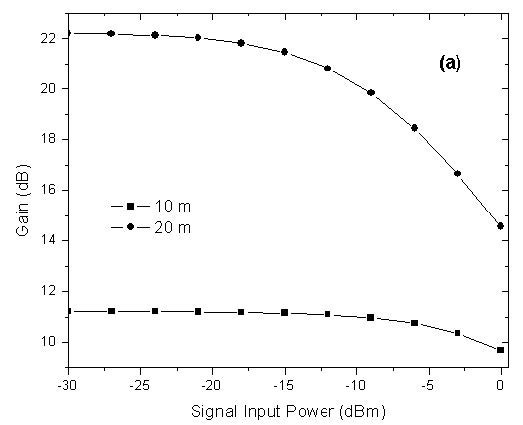
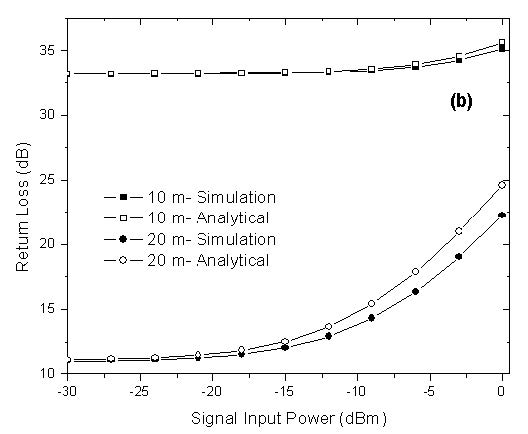
The gain obtained from simulations without consider the Rayleigh scattering effect is shown in Figure 4. This gain as function of the signal input power was obtained for two fiber lengths, 10m and 20m. These two curves were used in Equation 1 to calculate the return loss. The results of the simulations, including the Rayleigh scattering, and the analytical results are shown in Figure 4.
Figure 4: (a) Simulated gain at 1558 nm. (b) Return loss at 1558 nm versus signal input power
Note: Distance at 10m and 20m for both.
The results shows good agreement with the fiber length of 10m. For 20m of EDF, the results start to show considerable differences at input power of -15dBm. This happens because the analytical model is only reliable for population’s inversion approximately constants [2].
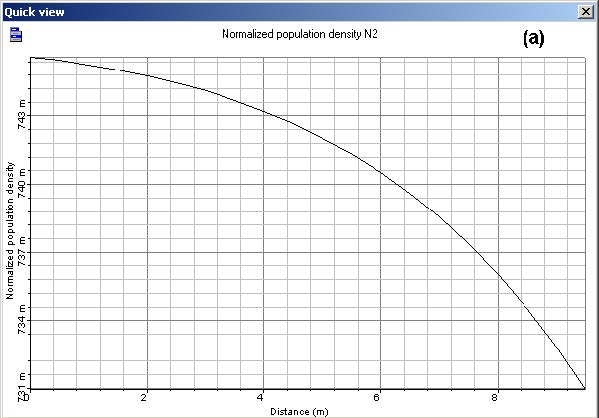
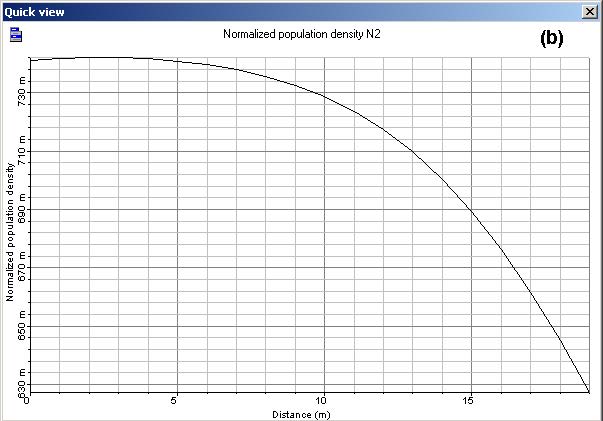
For the case of 20m, the variations of the inversion of population along the EDF are related to the differences between the results. Figure 5 shows the normalized population of the metastable level for the EDF length of 10m (a) and 20m (b) for an input signal power of -10dBm. The variations of the normalized population along the fiber are approximately 0.01 for 10 m of fiber and larger than 0.11 for 20m of fiber. This explains the increase in the differences between analytical and simulation result for the fiber length of 20m.
Figure 5: Normalized population at the metastable level as function of the fiber length for an input signal power of -10 dBm and EDF length of (a) 10 m, (b) 20 m
References:
[1]S. L. Hansen, K. Dybdal, and C. C. Larsen. “Gain Limited in Erbium-Doped Fiber Amplifiers Due to Internal Rayleigh Backscattering”. IEEE Photonics Technology Letters, Volume 4, Issue 6, Jun. 1992.
[2]P. F. Wysocki, G. Jacobovitz-Veselka, D. S. Gasper, S. Kosinski, J. Costelloe, and S. W. Granlund. “Modeling, Measurement, and a Simple Analytic Approximation for the Return Loss of Erbium-Doped Fiber Amplifiers”. IEEE Photonics Technology Letters, Vol 7, no 12, December 1995.


