This lesson demonstrates generating the transients based on add-drops in signals in a Raman amplifier.
In this example, we simulate a counter-pumped Raman amplifier for a small number of signals. Then the results are compared with the ones found in the literature.
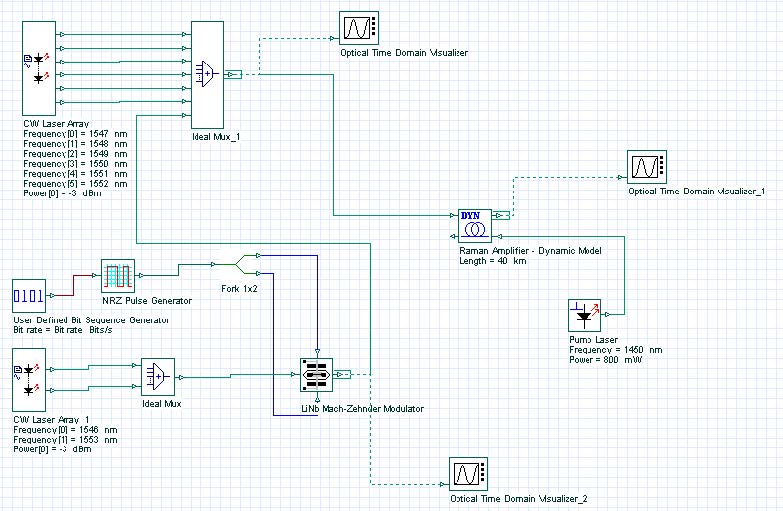
The project consists of a simple model as shown in Figure 1.
Figure 1: Project Layout for analysis of the Raman gain
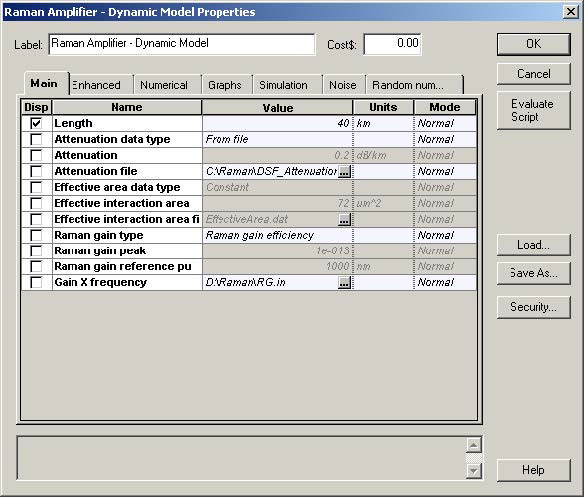
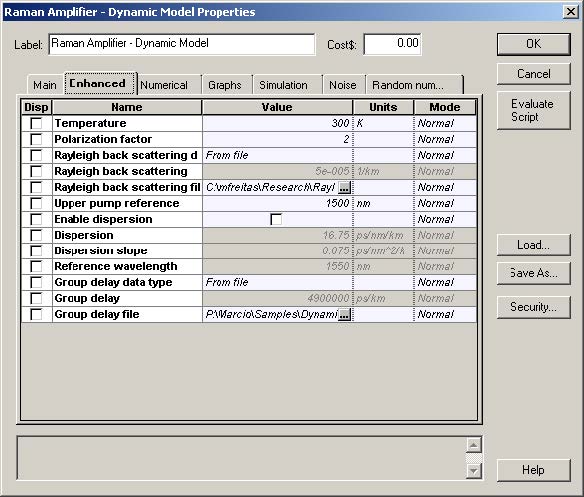
The amplifier has following parameters: length L = 40 km, amplifier absolute temperature = 300 K, polarization factor = 2. The background loss and the Raman gain efficiency are defined through files. These parameters are introduced in the tabs of the Raman component:
Figure 2: Amplifier parameters
As we can see, when the gain type is set to “Raman gain efficiency”, the effective area and Raman peak are not chosen. The upper pump reference is set to 1500nm, after the amplifier is pumped at 1450 nm and the signals start from 1546 nm.
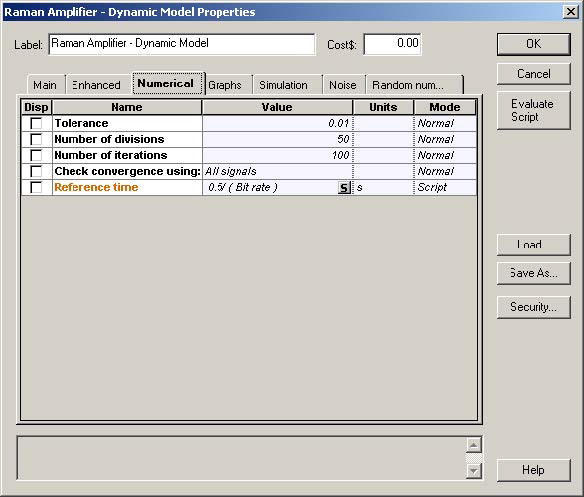
The tab “Numerical” is used to set the numerical parameters for the calculation. As we do not need a very accurate gain calculation in order to observe the transients, we set the number of divisions to 50 and the tolerance to just 0.01. It will make the execution much shorter. The convergence will be checked using all the signals.
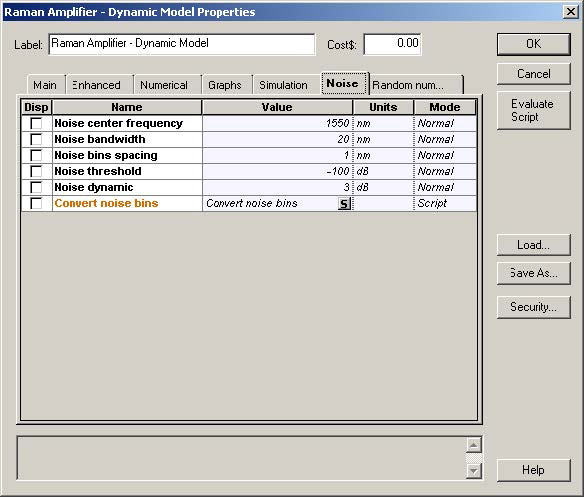
Figure 3: Numerical settings
Figure 4: Description of ASE
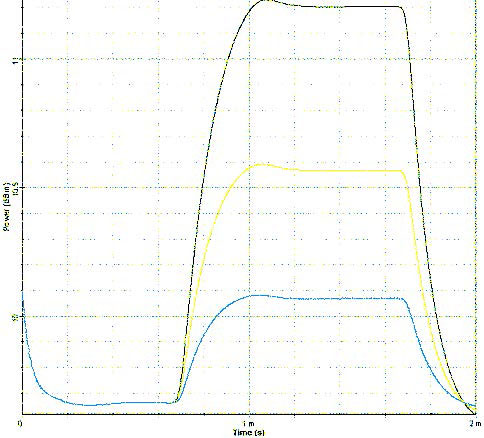
We transmit 8 channels located between 1546 and 1553 nm and -3 dBm power per channel. We have defined three iterations where we drop/add 2, 4 or 6 channels out of the 8 transmitted. After this is done, we compare the surviving-channel-power fluctuation as a function of time. We chose the signal with wavelength equal to 1546, as the surviving one that we will monitor.
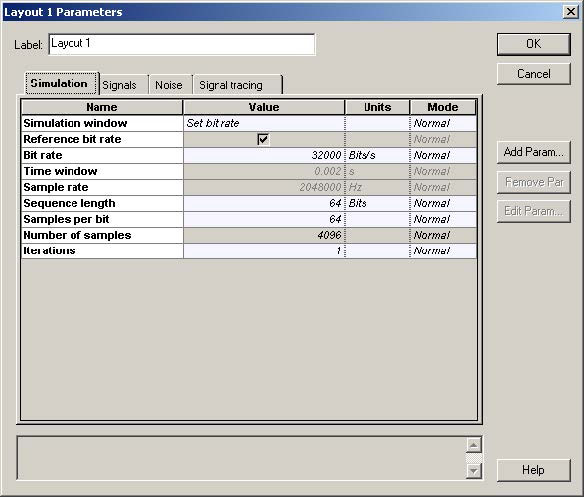
A very important setting is the sample rate that will define the size of the time step Δt.
According to [1], the ratio of time and space bins must be Δ t / Δ z ≤ 4 X 10⁻⁹ independently of the Raman fiber length. In the present case, the space bin is set equal to 800m, so the time bin must be at least 3.2 X 10 -6 . Therefore, the number of samples must be at least 1.25 X 10³, and we set it to 4096, which is supposed to be more than necessary for the current problem.
Figure 5: Layout parameters
The surviving channel power fluctuation is displayed Figure 6.
Figure 6: Surviving-channel-power fluctuation as a function of time when 2, 4 or 6 out of 8 channels are dropped/added
Reference:
[1]M. Karasek, M. Menif, “Protection of surviving channels in pump-controlled gain-locked Raman fibre amplifier”, Optics Communications 210 (2002) 57-65.


