Optiwave software can be used in different industries and applications, including Fiber Optic Communication, Sensing, Pharma/Bio, Military & Satcom, Test & Measurement, Fundamental Research, Solar Panels, Components / Devices, etc..
OptiSystem is a comprehensive software design suite that enables users to plan, test, and simulate optical links in the transmission layer of modern optical networks.
OptiSPICE is the first circuit design software for analysis of integrated circuits including interactions of optical and electronic components. It allows for the design and simulation of opto-electronic circuits at the transistor level, from laser drivers to transimpedance amplifiers, optical interconnects and electronic equalizers.
OptiFDTD is a powerful, highly integrated, and user friendly CAD environment that enables the design and simulation of advanced passive and non-linear photonic components.
OptiBPM is a comprehensive CAD environment used for the design of complex optical waveguides. Perform guiding, coupling, switching, splitting, multiplexing, and demultiplexing of optical signals in photonic devices.
OptiFiber The optimal design of a given optical communication system depends directly on the choice of fiber parameters. OptiFiber uses numerical mode solvers and other models specialized to fibers for calculating dispersion, losses, birefringence, and PMD.
Emerging as a de facto standard over the last decade, OptiGrating has delivered powerful and user friendly design software for modeling integrated and fiber optic devices that incorporate optical gratings.
OptiConverge is a collaborative integration framework that seamlessly combines two or more Optiwave products (e.g., OptiSystem, OptiSPICE, OptiFDTD, etc.) and other third party products into unified solutions. Designed to streamline complex workflows, it empowers users to achieve their goals faster by harnessing the collective power of our trusted Optiwave tools.
Decay of Higher Order Solitons in the Presence of Intrapulse Raman Scattering
Home » Tutorials » Decay of Higher Order Solitons in the Presence of Intrapulse Raman Scattering
Compatibility:
This lesson demonstrates the influence of stimulated Raman scattering on short soliton pulses.
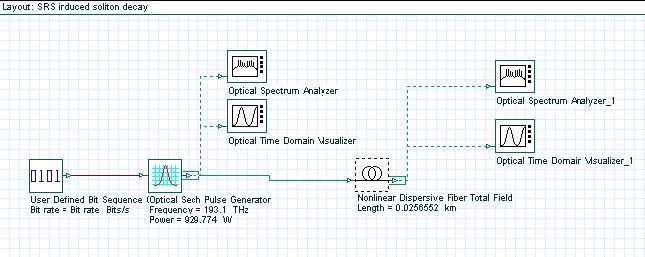
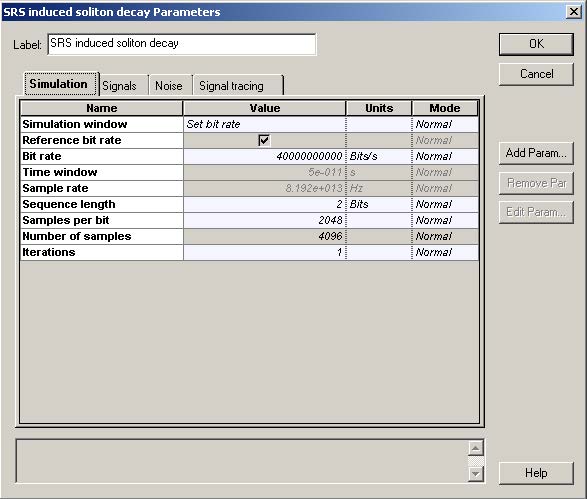
The layout and its global parameters are shown in Figure 1.
Figure 1: Layout and global parameters
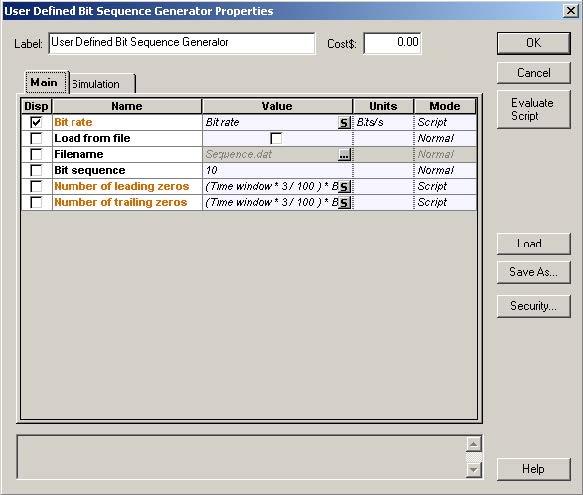
Figure 2: Setup for the Bit sequence generator
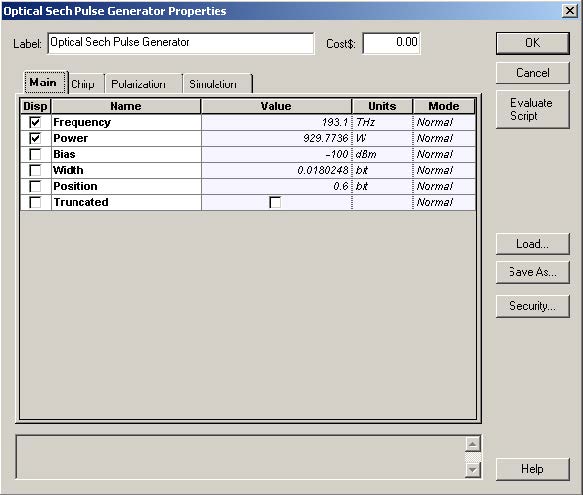
Figure 3: Setups for the Sech-pulse generator
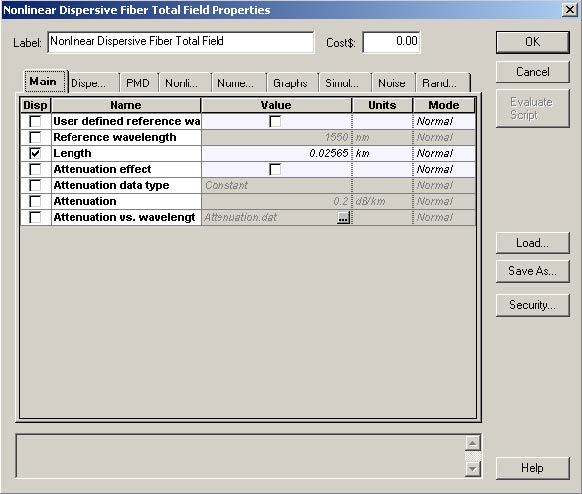
The parameters of the nonlinear dispersive fiber component are shown in Figure 4.
The layout simulates N=2 soliton pulse propagation within five soliton periods [1].
The pulse width (FWHM) is 450.62fs, with the corresponding value of T0 being T0 ≈ (TFWHM/ 1.763) = 255.6fs.
Figure 4: Parameters of the nonlinear dispersive fiber component
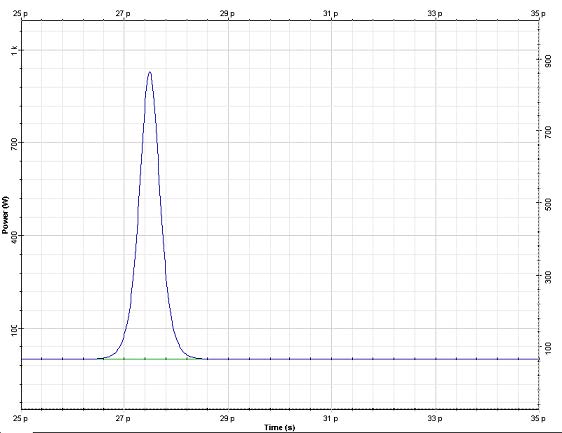
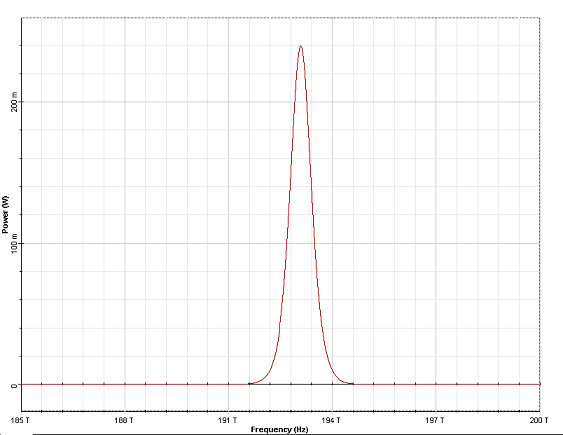
Figure 5: Input pulse shape (top) and spectrum (bottom)
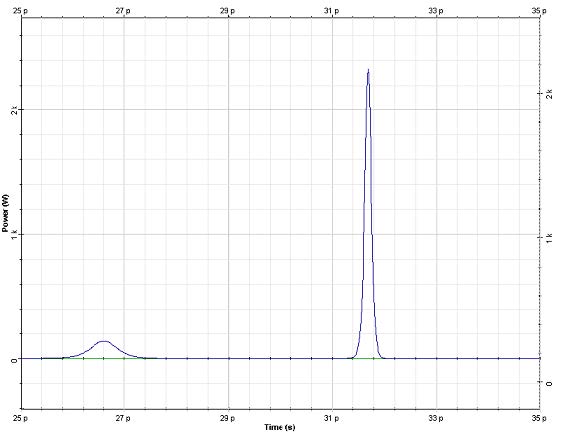
Figure 5 shows the input pulse shape and spectrum. The output (after five soliton periods of propagation) pulse shape and spectrum are shown in Figure 6. It can be seen that the effect of stimulated Raman scattering on the higher-order soliton is to split it into its constituents [1].
Figure 6: Output (at five soliton periods) pulse shape (top) and spectrum (bottom)
Moreover, the frequency domain manifestation of this effect (soliton self-frequency shift) can be clearly seen upon comparing the input and output pulse spectrum.
The normalized frequency shift:
agrees well with that presented in [1].
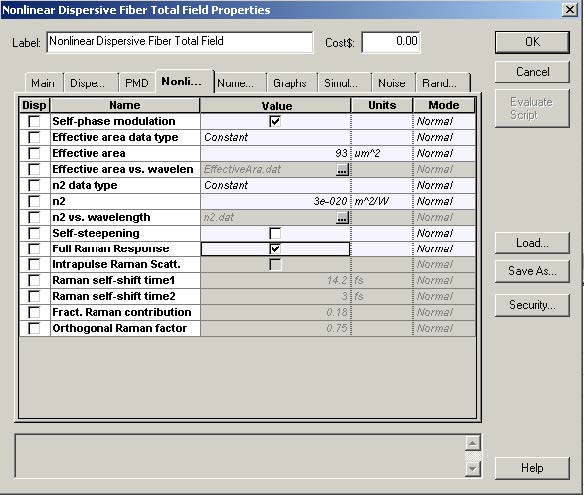
The same layout can be used to demonstrate the applicability of the approximation of the full Raman response of the material with the intrapulse Raman scattering in the case when the signal bandwidth is much narrower compared to the Raman gain spectrum [1], which is the case considered here. To achieve this we choose “Full Raman response” in the Nonlinear dispersive fiber (Non-linearities tab) (Figure 7).
Figure 7: Full Raman response in the nonlinear dispersive fiber
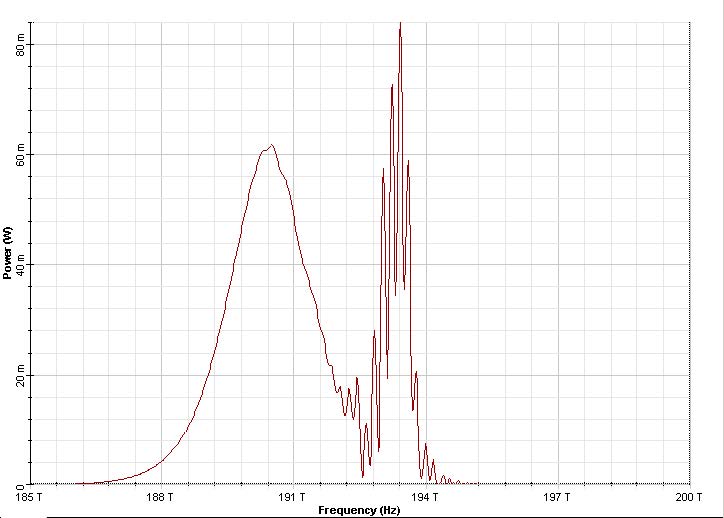
The rest of the setup remains unchanged. The obtained output spectrum is shown in Figure 8.
Figure 8: Output pulse spectrum at five soliton periods Full Raman response is used in the nonlinear dispersive fiber.
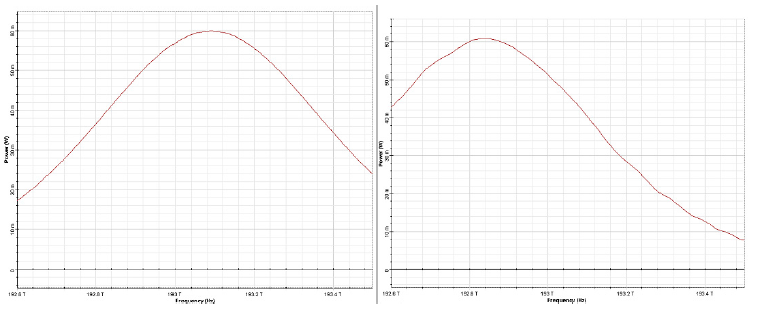
The remainder of this lesson demonstrates a phenomenon known as soliton self-frequency shift.
In order to do this, we make the following changes to the layout (see Figure 9):
Figure 9: Input (left) and output at 50 soliton periods (right) pulse spectra
The normalized red shift of the soliton frequency is:
On the other hand, the same quantity if arrived at with the following expression [1]:
which agrees with the results we obtained.
Reference:
[1] G. P. Agrawal Nonlinear Fiber Optics, Academic Press (2001).