Optiwave software can be used in different industries and applications, including Fiber Optic Communication, Sensing, Pharma/Bio, Military & Satcom, Test & Measurement, Fundamental Research, Solar Panels, Components / Devices, etc..
OptiSystem is a comprehensive software design suite that enables users to plan, test, and simulate optical links in the transmission layer of modern optical networks.
OptiSPICE is the first circuit design software for analysis of integrated circuits including interactions of optical and electronic components. It allows for the design and simulation of opto-electronic circuits at the transistor level, from laser drivers to transimpedance amplifiers, optical interconnects and electronic equalizers.
OptiFDTD is a powerful, highly integrated, and user friendly CAD environment that enables the design and simulation of advanced passive and non-linear photonic components.
OptiBPM is a comprehensive CAD environment used for the design of complex optical waveguides. Perform guiding, coupling, switching, splitting, multiplexing, and demultiplexing of optical signals in photonic devices.
OptiFiber The optimal design of a given optical communication system depends directly on the choice of fiber parameters. OptiFiber uses numerical mode solvers and other models specialized to fibers for calculating dispersion, losses, birefringence, and PMD.
Emerging as a de facto standard over the last decade, OptiGrating has delivered powerful and user friendly design software for modeling integrated and fiber optic devices that incorporate optical gratings.
OptiConverge is a collaborative integration framework that seamlessly combines two or more Optiwave products (e.g., OptiSystem, OptiSPICE, OptiFDTD, etc.) and other third party products into unified solutions. Designed to streamline complex workflows, it empowers users to achieve their goals faster by harnessing the collective power of our trusted Optiwave tools.
The objective of this lesson is to demonstrate the response of the delay interferometer when the wavelength and polarization of the input signal changes.
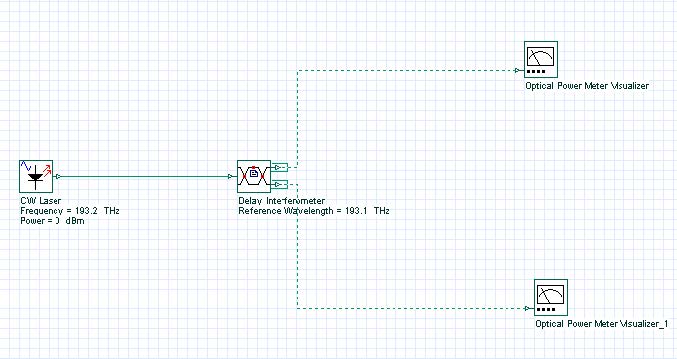
Figure 1 shows the system layout designed. See sample InterferometerCharacterization.osd.
Figure 1: Output Power x Signal wavelength system layout
The Frequency parameter in the CW laser is in sweep mode and the frequency vary from 193.0 THz to 193.2 THz.
The maximum IL in the Interferometer is 30 dB, the delay is 0.025 ns and the reference frequency is 193.1 THz.
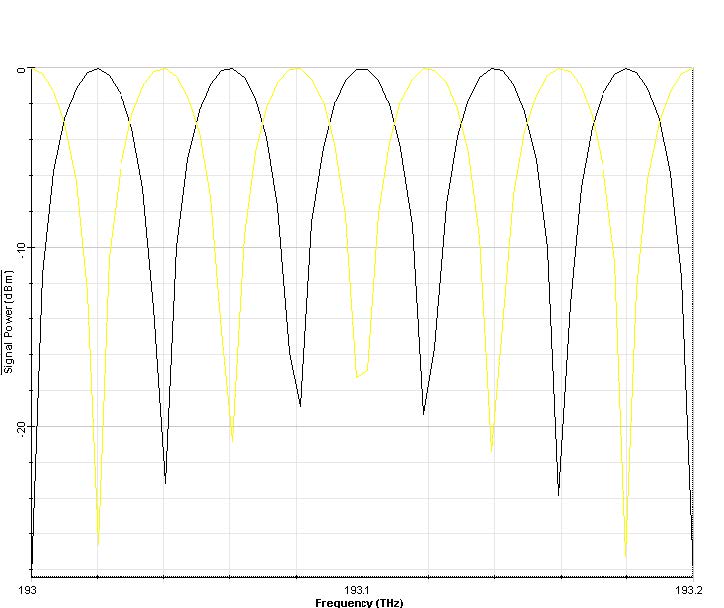
Figure 2 shows the response in the two output ports for each frequency simulated.
Figure 2: Output signal power at Output port 1 and 2
The curve that presents the 0 dBm at 193.1 THz is the response at output port 1. At the same frequency, for output port 2 the signal power should be around -30 dBm. The frequency spacing between the maximum power peaks at each curve is 40 GHz (1/0.025 ns).
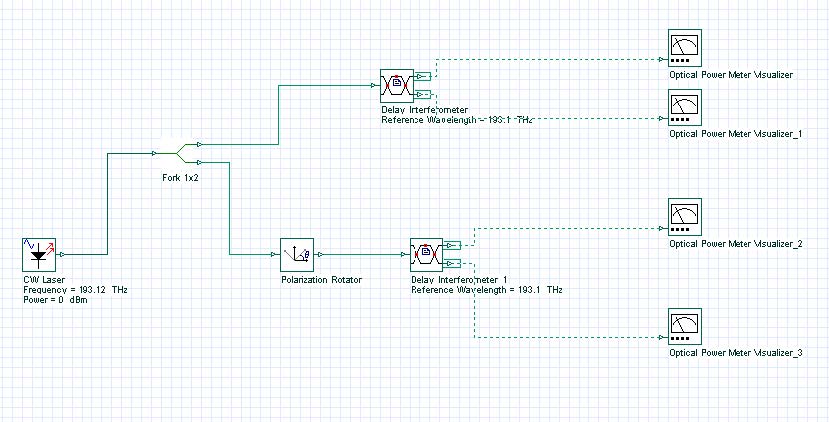
To be able to see the effect of the parameter PDF, “polarization-dependent frequency shift”, we simulate a system with two delay interferometers.
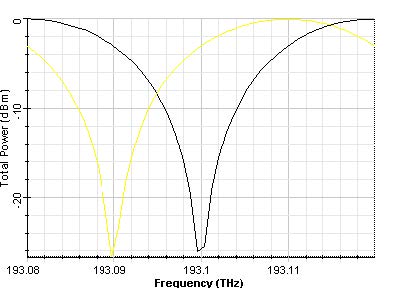
One of delay interferometers will have an input signal orthogonally polarized compared to the other. At this time the signal frequency will vary from 193.08 THz to 193.12 THz.
Figure 3 shows the system layout.
Figure 3: System layout to compare two signals with different polarizations
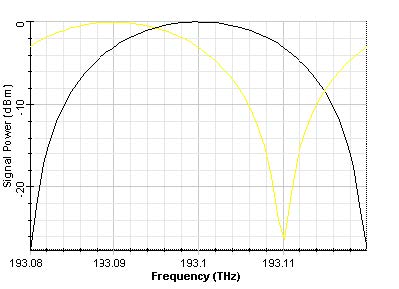
The Polarization-dependent Frequency Shift parameter value for each interferometer simulated was 10 GHz.
The responses are plotted in Figure 4(a) for output ports 1 and Figure 4(b) for output ports 2.
(a)
(b)
Figure 4: Output signal power (a) at output port 1 and (b) output port 2
We can see in Figure 4 that the difference in the input signal polarization causes a shift of 10 GHz in the curves from different interferometers. This shift is the polarization-dependent frequency shift specified in the interferometers.
Finally, we analyze the variation in the polarization in the input signal using a polarization rotator varying the angle from 0 to 360 degrees.
Figure 5 shows the system simulated.
Figure 5: Polarization analysis system layout
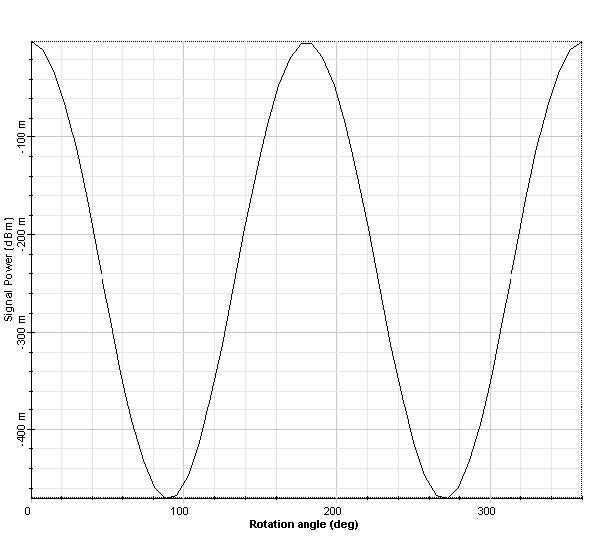
In this case, we have put the PDF value as zero, and the polarization dependent loss, PDL, of 0.5 dB was specified.
In Figure 6 we can see that the variation in the polarization causes an additional loss and its maximum value is 0.5 dB for signals orthogonally polarized.
Figure 6: Output signal power x polarization angle