Click the “Scan Fundamental Mode” icon in the Navigator pane. The “Properties of
Fundamental Mode” dialog box appears.
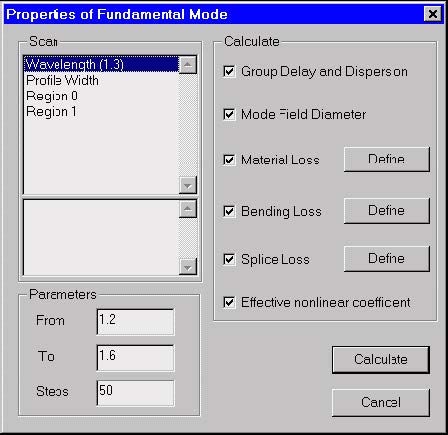
Do the following steps:
| Step | Action |
| 1 | Press the “Calculate” button. The routines calculate all characteristics checked in the Calculate section. In the “Views” window, you can now see graphs of these characteristics. |
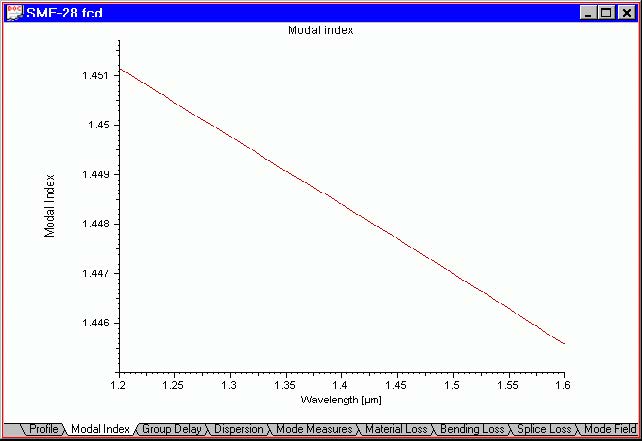
| 2 | Click the “Modal Index” tab to see the plot of the effective refractive index versus wavelength |
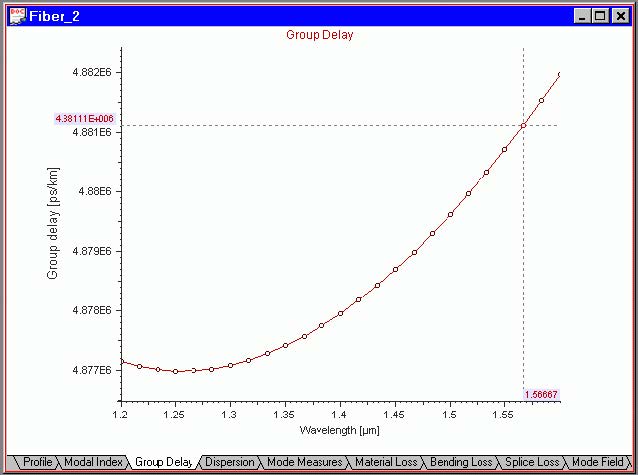
| 3 | Click the “Group Delay” tab to see the plot of the group delay versus wavelength: |
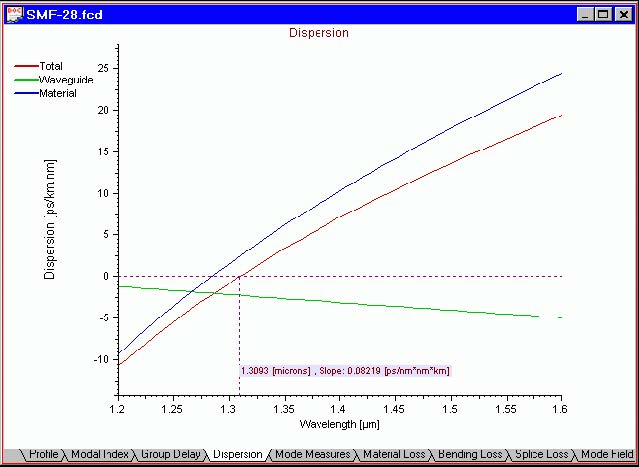
| 4 | Click the “Dispersion” tab to see the plot of the group delay versus wavelength: |
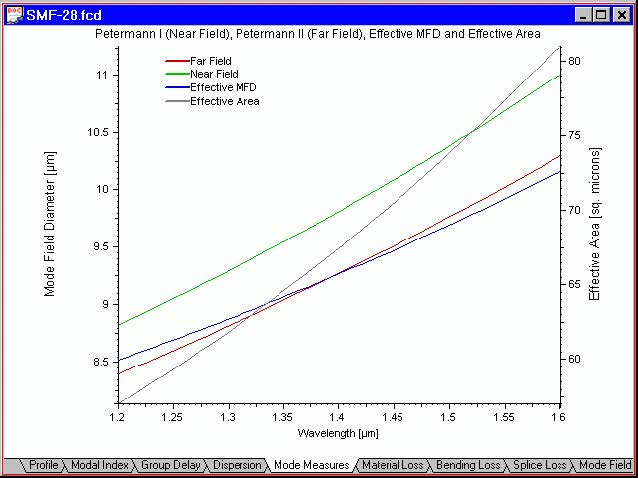
| 5 | Click the “Mode Measures” tab to see the plot of the mode field diameters versus wavelength: |
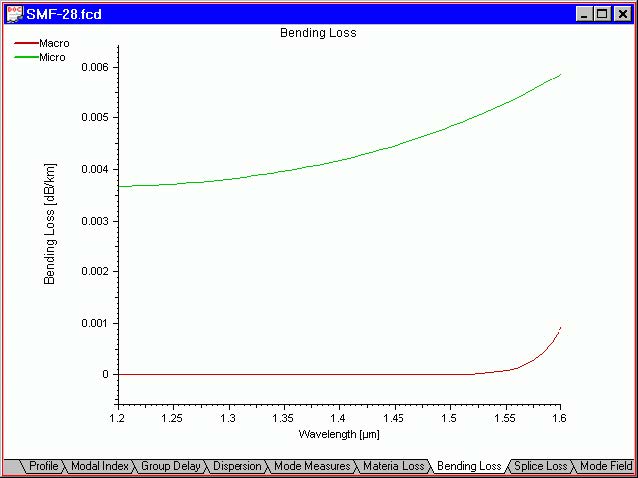
| 6 | Click the “Bending Loss” tab to see the plot of the micro- and macrobending loss versus wavelength: |
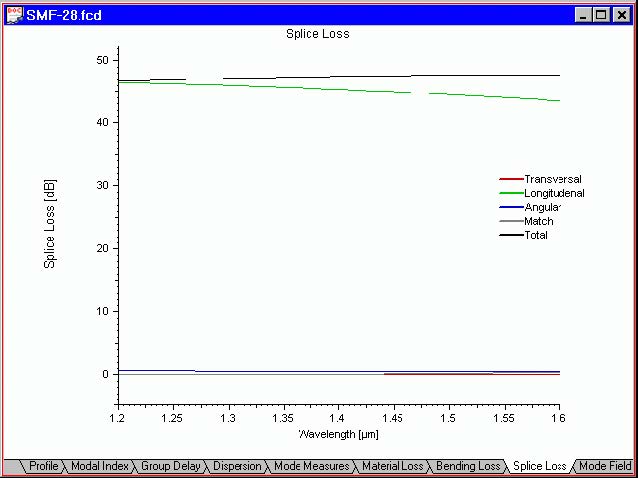
| 7 | Click the “Splice Loss” tab to see the plot of splice loss versus wavelength: |
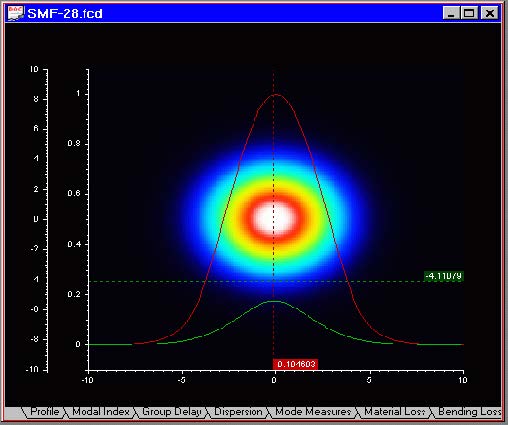
| 8 | Click the “Mode Field tab” to see the plot of the LP(0,1) mode field versus transverse dimensions of the fiber: |
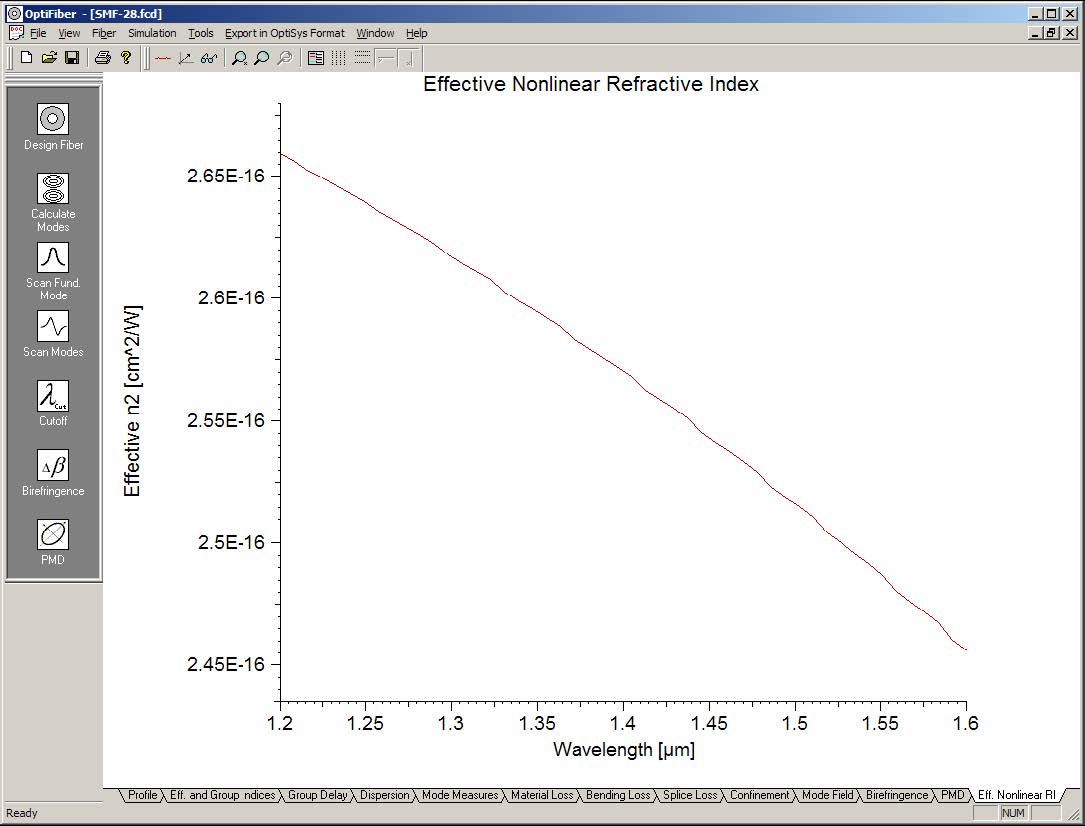
| 9 | Click the “Eff. Nonlinear RI” to see the plot of this parameter. Its definition is given in the “Technical Background“ section |