This lesson continues to study the effect of gain saturation induced self-phase modulation on the amplification of optical pulses. We will concentrate on the pulses with different shape and initial frequency shift. The chirped Gaussian input pulses are the pulses which are usually produced from directly modulated semiconductor lasers.
As in SOA gain saturation—Gaussian pulses, we will consider the pulses with a pulse width much shorter than the carrier lifetime. The carrier wavelength of the Gaussian pulse is 1.55 mm.
In first part of this lesson, we will look at chirped Gaussian pulses. In the second part of this lesson, we will look at super Gaussian pulses.
Saturation of amplification of chirped Gaussian pulse
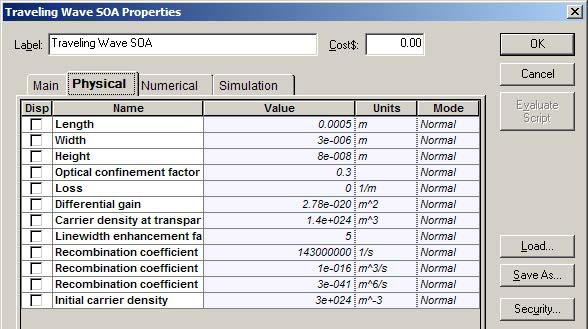
See Figure 1 for the SOA parameters.
Figure 1: SOA parameters
For these SOA physical parameter default values, the following parameter values are obtained:
- Carrier lifetime tC ~ 1.4 ns
- Saturation energy Esat ~ 3.7 pJ
- Amplification factor G0 = 29 dB
As a typical value of the line width, the enhancement factor α = 5 is used.
Gaussian pulse with the following parameters was considered:
- Energy E0 ~ 0.73 pJ
- TFWHM = 14 ps P ~ 50 mW
Chirp line width enhancement factor = 5
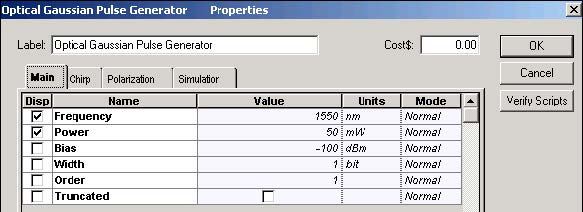
To obtain the required carrier wavelength and power, the following chirped and super Optical Gaussian Pulse Generator parameters are selected (see Figure 2 and Figure 3).
Figure 2: Chirped Gaussian Pulse Generator parameters
Figure 3: Super Gaussian Pulse Generator parameters
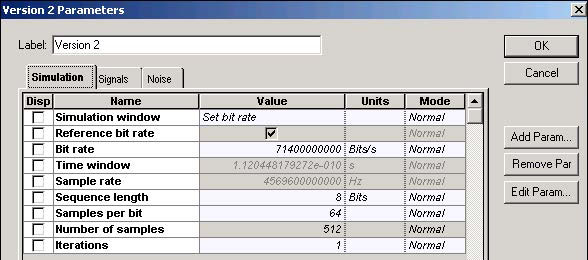
To obtain the chirped and super Gaussian pulse with desired TFWHM = 14 ps, the following global parameters are selected (see Figure 4).
Figure 4: Gaussian pulse global parameters
As a result of selecting these parameters:
T0 / tC ~ 0.006 and E0 / Esat ~ 0.2
According to the first ratio, the input pulse width is much smaller than the carrier lifetime. The second ratio shows that the pulse energy is comparable with the SOA saturation energy.
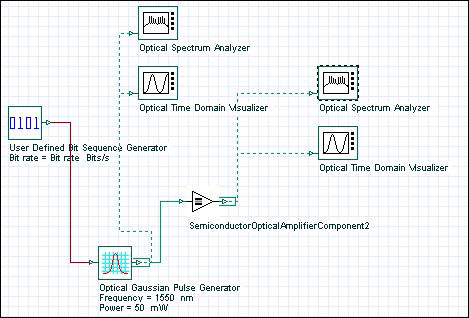
Figure 5 shows the project framework in which the amplification of the Gaussian pulse with SOA will be analyzed.
Figure 5: SOA Gaussian pulse project layout
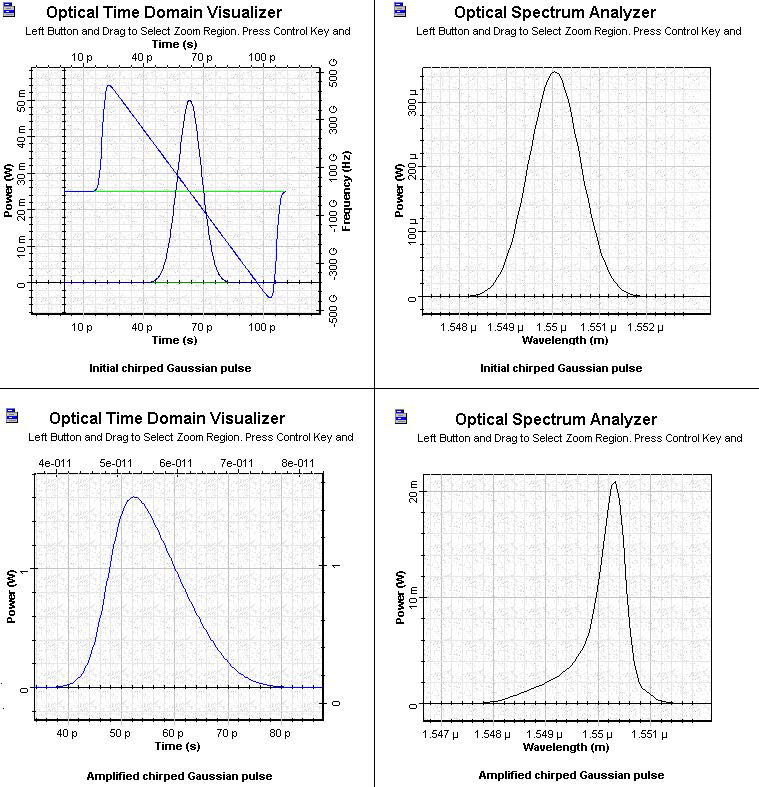
Figure 6 shows the shape and spectrum of the initial and amplified chirped Gaussian pulses.
Note: The frequency in the first graph decreases with time across the pulse, which is usually referred to as negative chirp.
Figure 6: Initial and amplified chirped Gaussian pulses
The first graph shows the expected sharpening of the leading edge. Note the different form of the output pulse spectrum and the reduced red shift in comparison with the amplified Gaussian pulse.
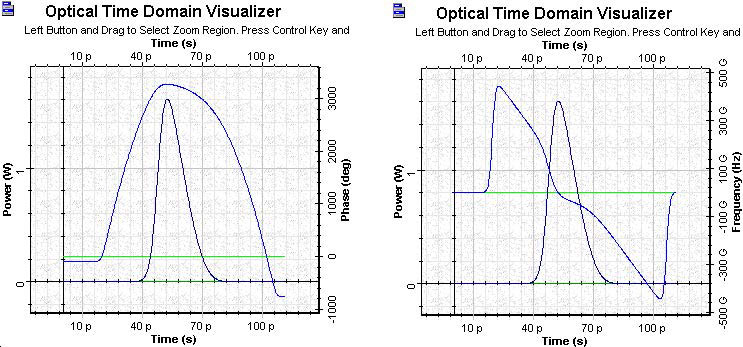
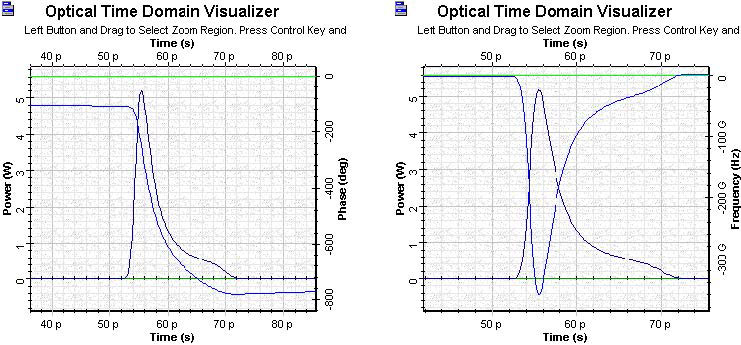
Figure 7 shows the gain saturation-induced chirp across the pulse and the deformation of the initial negative chirp after amplification.
Figure 7: Gain saturation-induced chirp across the pulse and deformation of the initial negative chirp after amplification
For negative initial chirp the gain saturation induced red shift decreases. (Compare the red shift from the figure with pulse spectrum with this of the amplified Gaussian pulse from SOA gain saturation—Gaussian pulses.) For the opposite sign of initial chirp, the spectrum shifts even more to the red side than in the case of zero initial chirp.
Saturation of amplification of super Gaussian pulse
The additional pulse parameter considered for the super Gaussian pulse is m = 3.
Note: The pulse is now without initial chirp.
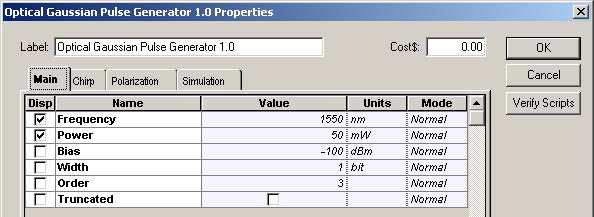
To obtain the additional order parameter, the following Optical Gaussian Pulse Generator parameters are selected (see Figure 8).
Figure 8: Super Gaussian Parameters
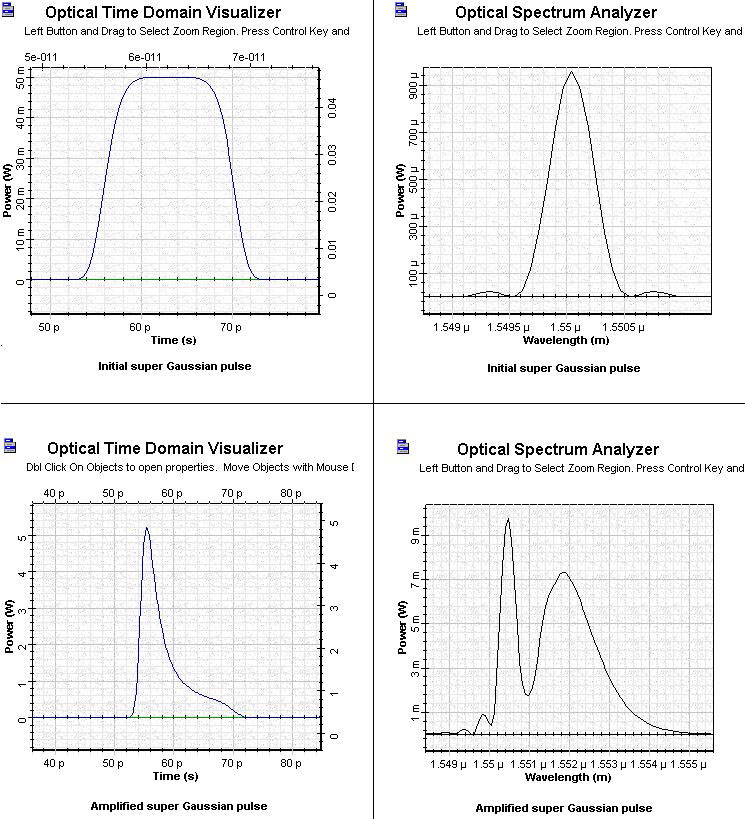
Figure 9 shows the shape and spectra of the initial and amplified super Gaussian pulse.
Figure 9: Initial and amplified super Gaussian pulse
The output pulse has a long tail on the trailing edge and appears to be narrower than the input pulse. This situation is very different from the case of the amplification of the Gaussian pulse where the TFWHM of the output pulse was larger than the TFWHM of the input pulse.
The spectrum of the output spectrum has a multi-peak structure and a very well- expressed red shift. Comparing this spectrum with the spectrum of the amplified Gaussian pulse, we can see that it is different. Therefore, the form of the spectrum and the amount of the red shift strongly depends on the initial pulse shape.
Figure 10 shows the shape and spectrum phase of the gain saturation-induced chirp across the pulse.
Figure 10: Amplified super Gaussian pulse phase and pulse frequency
This lesson described the basic properties of the chirped and super Gaussian pulse amplification with SOA component of OptiSystem software. We have shown that the shape and spectrum pulse distortions with an amplification of SOA strongly depends on the shape and initial frequency modulation of the pulse. These properties can be very important when pulses produced by directly modulated semiconductor lasers are amplified.
The obtained results are in complete agreement with the results published in [1] and [2].
References:
[1] G.P. Agrawal and N.A. Olsson, “Self-phase modulation and spectral broadening of optical pulses in semiconductor laser amplifiers”, IEEE Journal of Quantum Electronics, Vol. 25, pp. 2297-2306, 1989.
[2] G.P. Agrawal, “Fiber-Optic Communication Systems”, 2nd Edition, John Wiley & Sons Inc., 1997.


