The objective of this lesson is to demonstrate the possibility of simulating a packet- interleaved operation using OptiSystem.
In this case, the data stream externally modulates a periodic stream of narrow pulses.
Because the bit interval is T, the separation between successive pulses is also T.
In this way, we have to reduce the interval between successive pulses to T2, a high- rate multiplexed signal. This is done by passing the initial sequence through a series of compression stages.
If the size of each packet is L bits, the output goes through K compression stages
K = log 2( L )
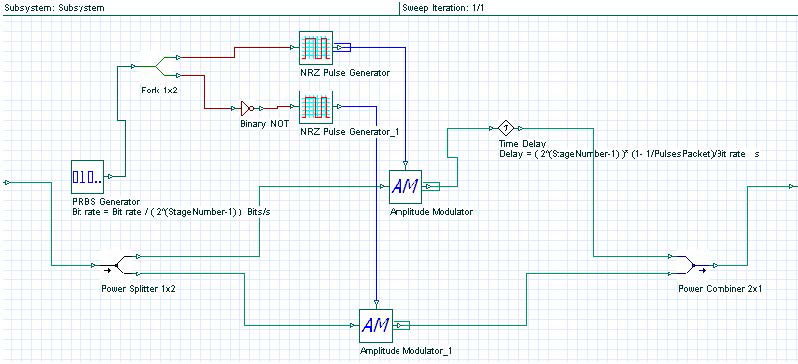
We have designed a compression stage with OptiSystem. See Figure 1.
The stage was implemented in a subsystem because each compression stage has the same layout.
The only difference between the compression stages were some parameters such as Bit rate at the PRBS Generator and the Delay at the Time Delay component. However, these parameters were set in script mode to allow the reuse of the subsystem.
Figure 1: Compression stage
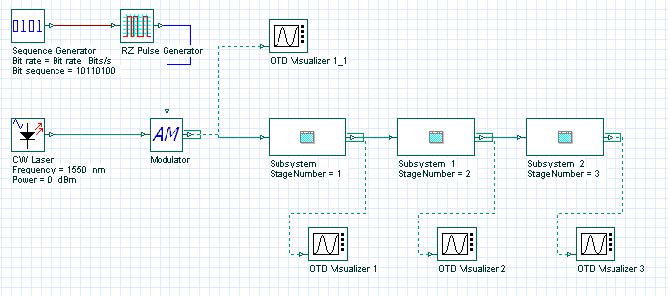
To demonstrate the packet interleaving, we have created a sample in which packets with 6 bits length are created.
The system in Figure 2 shows the layout with three compression stages.
In this layout we have introduced one new tab called Multiplexer. This tab will contain the PulseTime parameter that specifies the pulse width and the PulsesPacket parameter that specifies the number of bits per packet.
Figure 2: Packet interleaving with 6 bits/packet
The initial sequence modulated was 10110100 and the behavior of the optical signal along the transmission can be seen in Figure 3.
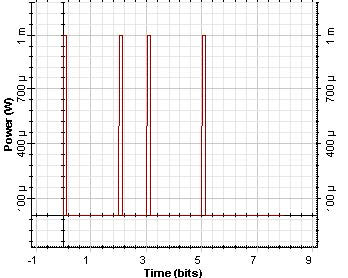
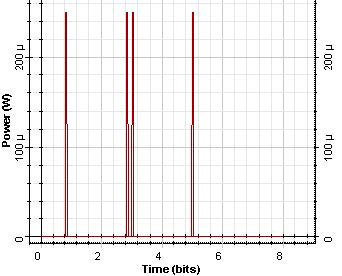
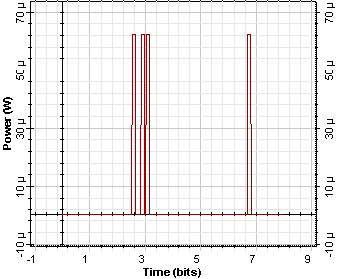
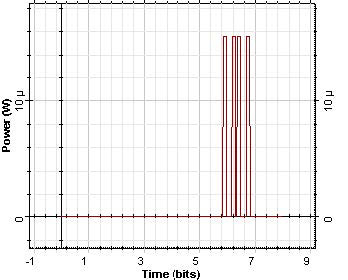
Figure 3: (a) Initial bit sequence, (b) bit sequence after CS1, (c) bit sequence after CS2, and (d) bit sequence after CS3
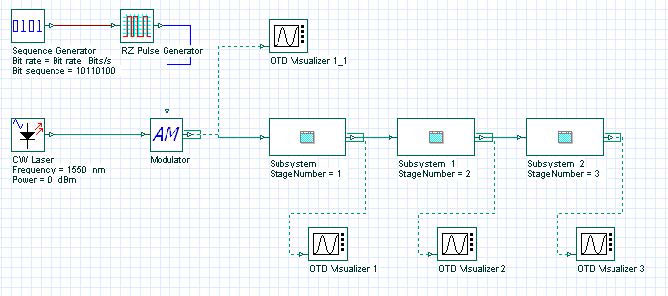
Another system was created, but this new one has 16 bits/packet and the initial sequence was pseudo-random.
Figure 4 shows the system layout for this case. Because the packet has 16 bits, the number of compression stages must be 4.
Figure 4: Packet interleaving with 6 bits/packet
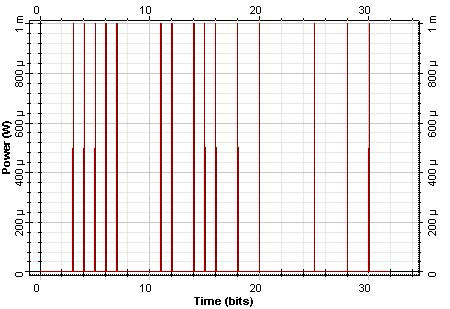
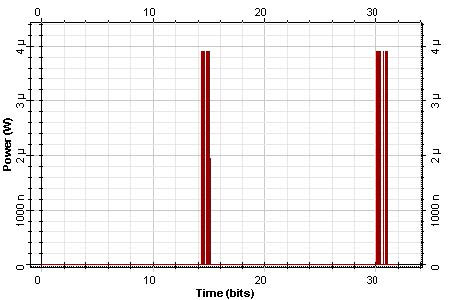
With an initial sequence of 32 bits, the formation of 2 packets can be seen in Figure 5.
References:
[1] R. Ramaswami and K. N. Sivarajan. Optical networks: A Practical Perspective – pp. 624


