For the differential mode delay measurement (DMD), an 850 nm probe is scanned at small radial increments across the core of the multimode fiber under test.
At each position the temporal response to a short impulse is recorded. After removal of the reference pulse temporal width, the DMD temporal width is determined at the 25% threshold level between the first leading edge and the last trailing edge of all traces encompassed between specified radial positions.
The DMD Analyzer tool encapsulates the necessary equipment to do this measurement in one component.
The fiber modal bandwidth can be measured in time domain, using a pulse of light launched into one end of the fiber and the temporal response of the output is measured. Conversion into the frequency domain reveals the bandwidth from the transfer function H(f), which is defined as the earliest frequency at which the amplitude drops 3 dB below the amplitude at zero frequency.
The Filter Analyzer component combined with the multimode generator can easily measure the fiber bandwidth.
DMD Measurement
System setup for a 50-μm Fiber
Using the default global parameters, we can start adding the components to analyze the fiber DMD.
From the component library, drag and drop the following component in to the layout:
- From “Default/Visualizers Library/Optical”, drag and drop the “Differential Mode Delay Analyzer” into the layout.
- From “Default/Optical Fibers/Multimode”, drag and drop the “Parabolic-Index Multimode Fiber” into the layout.
- For the fiber, set the parameter Attenuation to 0 dB/km and the Length to 300 m.
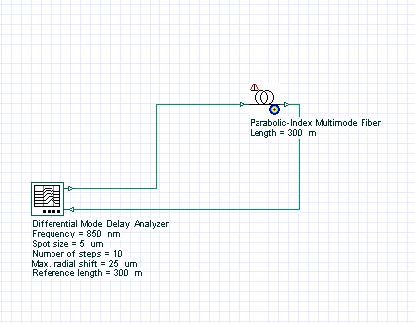
The next step is to connect the components according to the Figure 1.
Figure 1: DMD measurement layout
For this example, the DMD Analyzer will generate one Laguerre-Gaussian spatial mode LG00, with the spot size equal to 5 μm. The reference length is 300 m for the fiber and for the analyzer. The analyzer will generate 10 signals shifting the transverse mode from 0 to 25 μm. The expected result is the 50 μm fiber DMD graphs.
Running the simulation
We can run this simulation and analyze the results:
- To run the simulation, you can go to the File menu and select Calculate. You can also press Control+F5 or use the calculate button in the toolbar. After you select Calculate, the calculation dialog box should appear.
- In the calculation dialog box, press the Play button. The calculation should perform without errors.
Viewing the results
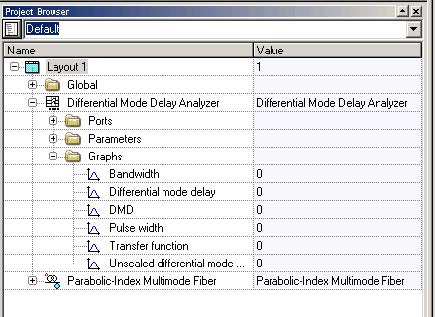
In order to see the results, go to the project browser and select the Graphs folder under the Differential Mode Delay Analyzer (Figure 2).
Figure 2: Differential Mode Delay Analyzer graphs
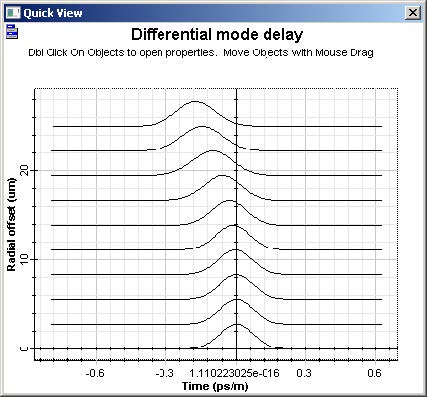
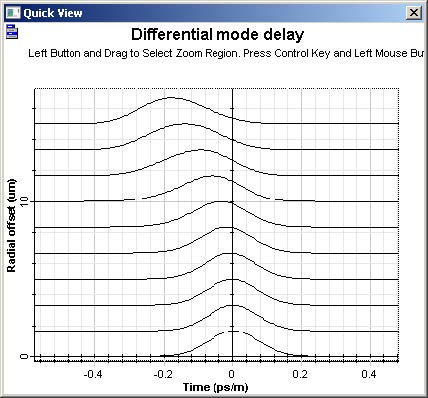
The main graph is the “Differential mode delay” graph (Figure 3). It shows the temporal-radial evolution of the fiber output pulse.
Figure 3: Differential mode delay graph for a 50 μm fiber
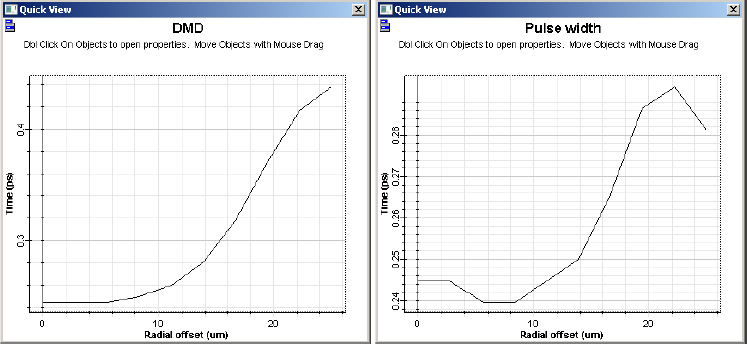
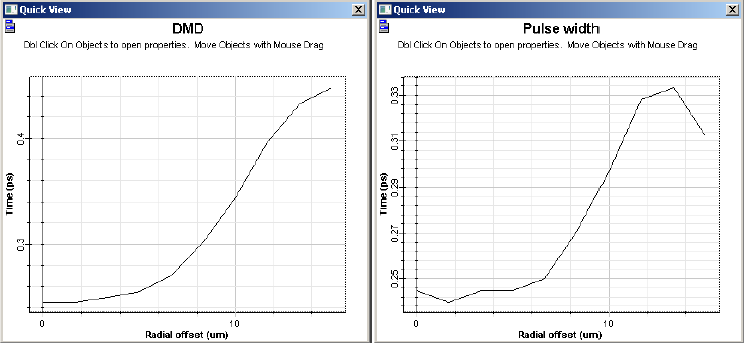
The analyzer can also calculate the DMD and the pulse width versus radial offset. Additionally, the fiber transfer function and bandwidth for a given input pulse can be calculated.
Figure 4: DMD and pulse width graphs for a 50 μm fiber
System setup for a 30 μm Fiber
We can repeat the same analysis for a fiber with 15 μm radius:
- For the fiber, set the parameter Core radius to 15 μm.
- For the analyzer, set the parameter Max. radial shift to 15 μm.
- Run the simulation
Viewing the results
Figures 5 and 6 present the results for the 30 μm fiber.
Figure 5: Differential mode delay graph for a 30 μmfiber
Figure 6: DMD and pulse width graphs for a 30 μm fiber
Modal Bandwidth Measurement
System setup
Using the previous 50 mm fiber, we can setup the measurement of the modal bandwidth:
- From “Default/Filter Library/Filter Analyzers”, drag and drop the “Optical Filter Analyzer” into the layout.
- For the filter analyzer, set the parameter Frequency to 850 nm, Frequency range to 20 GHz, Time domain to true, and the Frequency unit to Hz.
- From “Default/Transmitters Library/Multimode”, drag and drop the “Multimode Generator” into the layout.
- For the fiber, enable the parameter Const. mode power dist. (Numerical tab) and the parameter Length to 1 km.
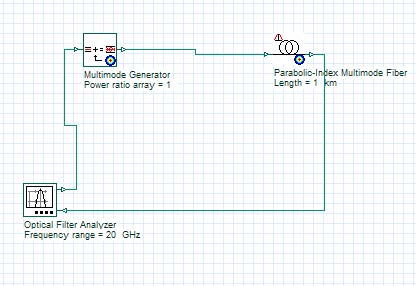
- Connect the components according to Figure 7.
Figure 7: Modal bandwidth measurement setup
The filter analyzer will generate a time domain impulse and will measure the fiber response. The fiber will generate a constant power distribution for the modes (MPD), which imitates an overfilled launch condition.
- Run the simulation
Viewing the results
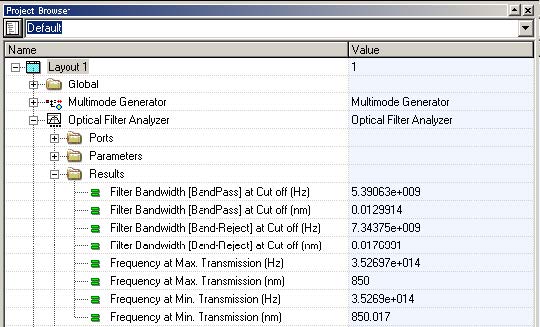
The filter analyzer also generates graphs and results using the project browser (Figure 8).
Figure 8: Filter Analyzer graphs and results
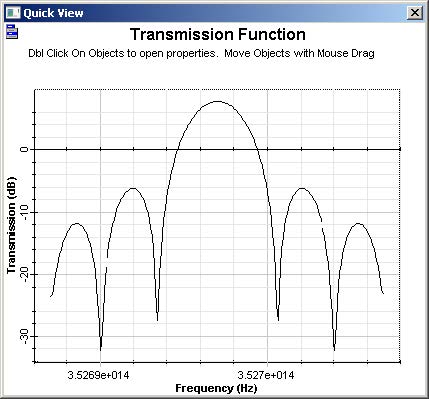
The fiber bandwidth can be calculated by the filter bandwidth parameter (5.39 GHz / 2 = 2.695 GHz.km). Additionally, the fiber transfer function can be displayed selecting the Transmission Function graph (Figure 9).
Figure 9: Fiber transfer function


