
Base
| Full Name | Jake Tran |
| Organization | PTIT |
| Job Title | Student |
| Country |
Forum Replies Created
Dear Damian,
I now understand your idea. Thanks to you, all the problems were solved. I am simulating and writing report. Thank you so much for helping me out. I am very grateful for your support.
Wish you all the best and hope to work with you in the near future.
Sincerely,
Jake.
Dear Damian,
I’m sorry but I don’t get your idea. I sweep the OSNR parameter and receive the linear BER result as expected (relatively followed the ‘BER vs SNR.jpg’) but I’m still curious now.
1/ Why do you change the MZM to LiNb MZM?
2/ Why are we using back the BER Analyzer instead of BER Test set. Is it impossible to do calculate BER vs OSNR with the demodulated signal from the output of the PPM Decoder (I see your dropped out the PPM Decoder and only calculate based on the modulated signal)?
3/ If I examine 8-PPM (3 bits per symbol), 16-PPM (4 bits per symbol), do I need to set the bit rate to 1/3 or 1/4 of the global bit rate?
4/ Why do you adjust the bit rate from the Pseudo-Random Bit Sequence? I think we just keep it equal to the global bit rate because the purpose of the modulation technique is to increase the number of bits carried in the same amount of time; hence, increase the rate of the whole system.
Thank you for your help so far. I really appreciate your kind support.
Sincerely,
Jake.
Dear Damian,
Thank you so much for your reply. The Clock Recovery component is really a key component to compensate the time delay.
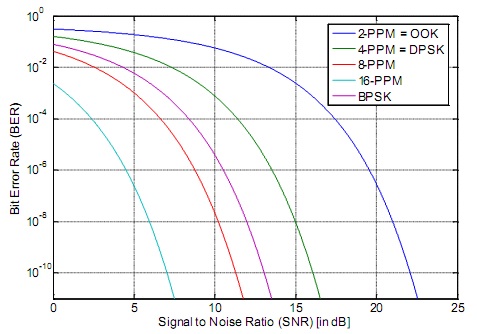
However, I still cannot receive a linear BER result correspond with the SNR. For example, in your edited project, when I sweep the SNR = 0,5,10,15,20,25; BER results in the BER Test set are only =0.5 (for SNR=0 and 5) or 0 (for SNR=10;15;20;25). I think these BER results don’t have any meanings at all because every time I receive a bit, I can always have the probability of 0.5 to guess if it was 0 or 1. There is no in-between BER result for example 0 -> 10e-7 -> 10e-5 -> 10e-3 -> 1, so that I can make a curve like the image I attached below.
Thank you very much Damian.
Sincerely,
Jake.
Attachments:
Dear Damian,
I am having some other problems regarding the BER Test set.
When I use the Set OSNR and BER Test set to plot BER vs SNR in PPM modulation (e.g 2 bit per symbol), I always receive the result in the BER Test set that BER ~ 0.5 or BER = 0. I tried to change the sequence length but it still had the same result. There is no linear BER result as expected when I sweep SNR parameter from 0 -> 25 dB.
Moreover, when I put the Set OSNR in the project, I notice that the binary signal at the output of Data Recovery is not the same as the signal at the output of PPM Coder every time I change the SNR parameter, although the signals of two outputs are the same before using Set OSNR (as I followed your project to compensate time delay in Data Recovery).
I would like to ask what should I do to receive a linear BER result? Do I need to adjust the Delay Compensation parameter in Data Recovery every time I change the SNR?
Thank you very much for your consideration.
Sincerely,
Jake.
Attachments:
Hi Damian,
Thank you for your reply. I have one more question. I want to make a graph with BER vs SNR to compare between different modulation techniques (OOK, 2-PPM, 4-PPM and so on). I don’t use any amplifiers in the project, so can I use the Set OSNR to find SNR in order to make the graph or I have to use other components?
Regards,
Jake.
Dear Damian,
Thank you so much for your reply. It helped me a lot. However I have some questions about the project, hope you can help me:
1/ In your revised project, the Min BER parameter of the BER Analyzer is still = 1, Eye Height = 1. Is there any other way that I can use to calculate BER?
2/ In the Layout parameter, you set the symbol rate parameter is twice the bit rate (symbol rate = 5Gbps, bit rate = 2.5Gbps). However, I think the symbol rate is supposed to be lower than the bit rate.
3/ How can you calculate the delay compensation parameter in the Data Recovery?
Once again, thank you very much for you help.
Regards,
Jake.
I need your help guys.
Can anyone help me please? Thank you!