
Base
| Full Name | Miguel Bernardo Trindade Simões da Silva Rosa |
| Organization | Instituto Superior Técnico, Universidade de Lisboa |
| Job Title | student |
| Country |
Forum Replies Created
Hello! If you the field distribution select the wavelength that you desire and select update graph. For the power, go to Power Spectrum, I think that is this that you want. Write the minimum and maximum wavelengths, select the normalize with and finally calculate. Don’t choose too much sample points, it takes time.
Sorry for the late Adnan! I usually work with the observation areas. I think that in the Y is the power normalized and in the decibel scale, I have that idea because of the options that you have selected. Why you don’t use a observation area?
Thanks very much Damien! It was a good help! Best regards
Yes ask, no problem,. If I could I will try to answer.
Hello! It’s V/m. How did you put that scale bar?
Good evening,
Could someone help me?
Regards,
Miguel Simões Rosa
Instituto Superior Técnico
Thanks very much Damian! Now it’s clear!
Best regards,
Miguel Simões Rosa
Good afternoon,
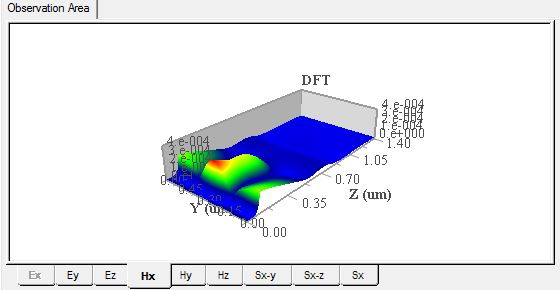
Thanks for the answer but what I want to know is the units used by the OptiFDTD in the presentation of the images of the distributions of the Electric and Magnetic Field.
For example in the second image, the image of distribution of the Magnetic Field, that I sent in attached, the maximum amplitude corresponds to 4e^-0.004. Is this value in Amps/meter?
Best regards,
Miguel Simões Rosa
Good afternoon.
Yes I know it. But isn’t it possible to change the axes to see where the dip begins?
Best regards,
Miguel Simões Rosa
Good evening,
Sorry I don’t know why but I couldn’t send the 2D Viewer file.
This is the image of the plot and of the 2D Viewer.
Best regards,
Miguel Simões Rosa
Attachments:
Thanks! Best regards
And for the Magnetic Field?
Attachments:
Good afternoon,
Thanks very much for the help.
At the date I got the same result because I’m doing 3D simulations, but I’m doing now another with better mesh parameters.
We think that the problem is in the definition of the APML layer, please if you could take look in the document that is in attached.
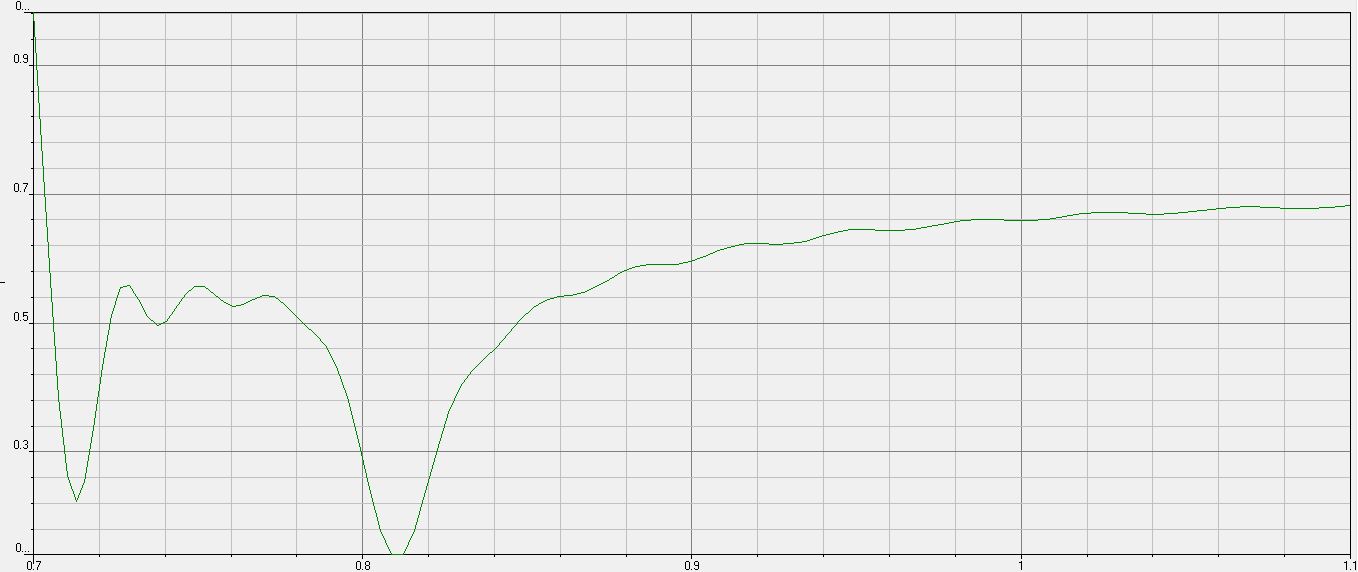
In this document you can see two plots, the first one, figure 1, is a spectrum obtained with the OptiFDTD and the second one is the plot obtained with Rsoft which is the correct one ( the result coincide with the experimental results).
The position of the first dip, the narrower in OptiFDTD is correct, is very similar to the one in the Rsoft but with OptiFDTD we can’t find the second dip, the broader one. Instead we observe a lot of small oscillations that we think that are related to undesired reflections.
Thanks for the attention,
Miguel Simões Rosa
Instituto Superior Técnico, Universidade de Lisboa
Attachments:
Good evening,
Thanks very much for the help!
Regards,
Miguel Simões Rosa
Ok thanks very much for the help!
Regards!