Optiwave software can be used in different industries and applications, including Fiber Optic Communication, Sensing, Pharma/Bio, Military & Satcom, Test & Measurement, Fundamental Research, Solar Panels, Components / Devices, etc..
OptiSystem is a comprehensive software design suite that enables users to plan, test, and simulate optical links in the transmission layer of modern optical networks.
OptiSPICE is the first circuit design software for analysis of integrated circuits including interactions of optical and electronic components. It allows for the design and simulation of opto-electronic circuits at the transistor level, from laser drivers to transimpedance amplifiers, optical interconnects and electronic equalizers.
OptiFDTD is a powerful, highly integrated, and user friendly CAD environment that enables the design and simulation of advanced passive and non-linear photonic components.
OptiBPM is a comprehensive CAD environment used for the design of complex optical waveguides. Perform guiding, coupling, switching, splitting, multiplexing, and demultiplexing of optical signals in photonic devices.
OptiFiber The optimal design of a given optical communication system depends directly on the choice of fiber parameters. OptiFiber uses numerical mode solvers and other models specialized to fibers for calculating dispersion, losses, birefringence, and PMD.
Emerging as a de facto standard over the last decade, OptiGrating has delivered powerful and user friendly design software for modeling integrated and fiber optic devices that incorporate optical gratings.
OptiConverge is a collaborative integration framework that seamlessly combines two or more Optiwave products (e.g., OptiSystem, OptiSPICE, OptiFDTD, etc.) and other third party products into unified solutions. Designed to streamline complex workflows, it empowers users to achieve their goals faster by harnessing the collective power of our trusted Optiwave tools.
I think I finally get it. Thank you for teaching me so much and thank you for your patience! You’re really a good teacher making such complicated things easy to be understood!
HI,Steve Dods
I’m afraid you misunderstand my question.I don’t care such little difference in this issue. What make me confused is how to understand the meaning of Power overlap integral.
Thanks anyway!
So I conclude as following:(please point out if I’m wrong )
At each z point the Power in path= (power in the waveguide)/(power in the all transverse mesh)
At each z point the Relative Power= (power in the all transverse mesh at z )/(power of input field )
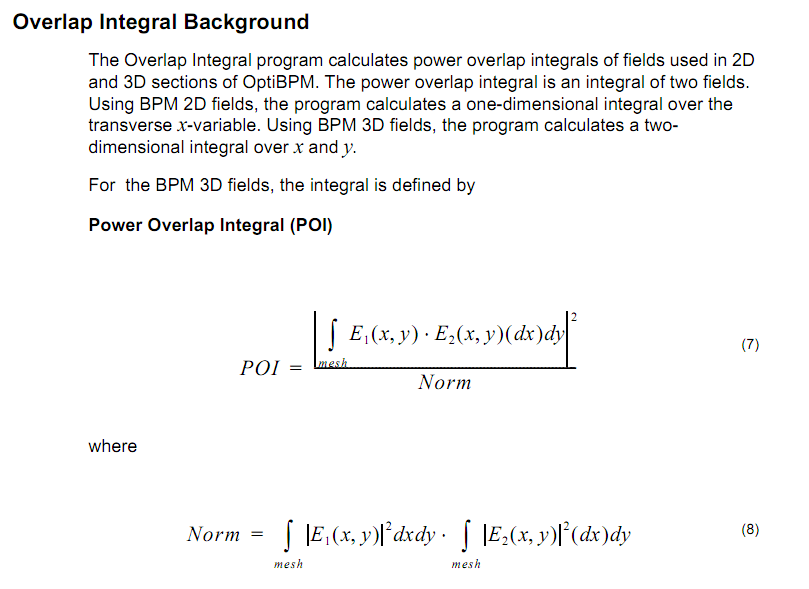
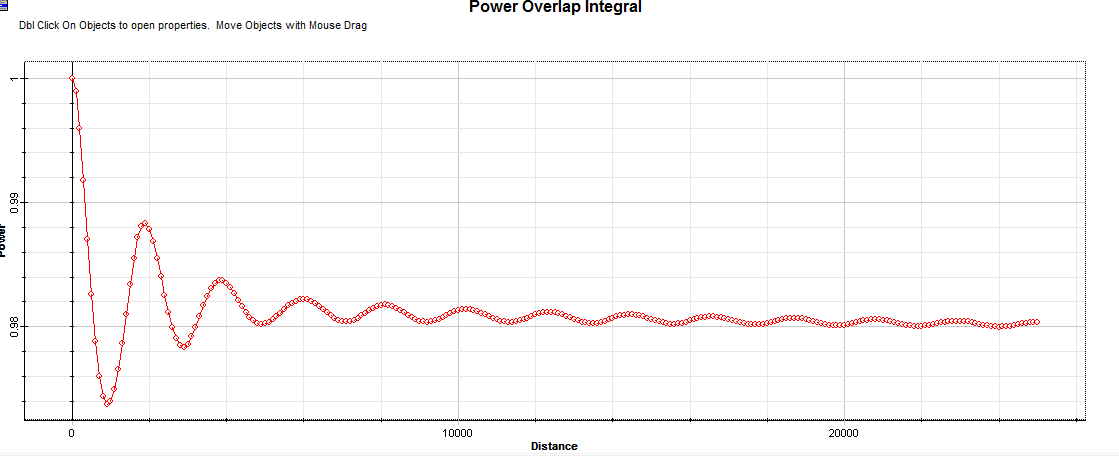
I’m still confused about Power overlap integral.
1.What dose the numerator and denominator mean in the formula of picture “POI.png”?
2.If the reference field is the input field, what’s the difference between Power overlap integral and Relative Power?
3.What does people usually use for with the results of Power overlap integral?
Hi,Damian Marek
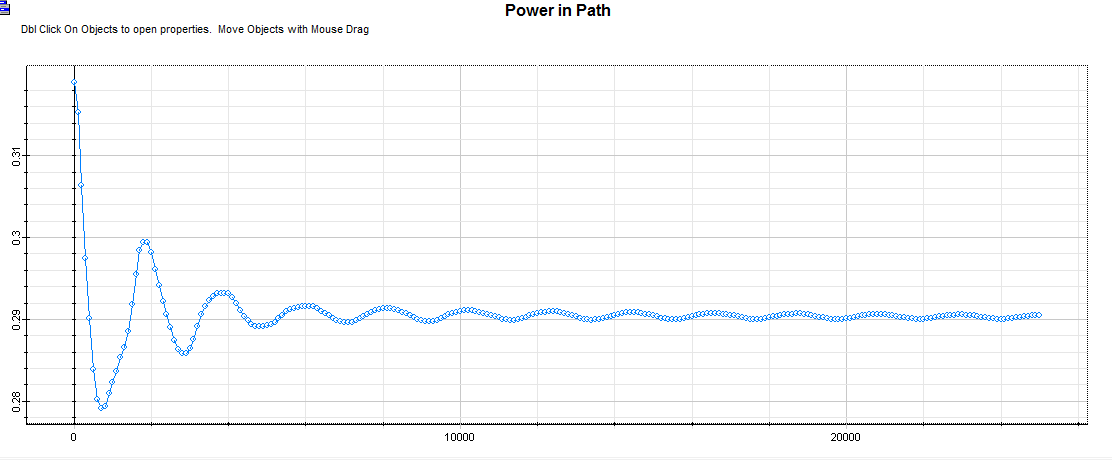
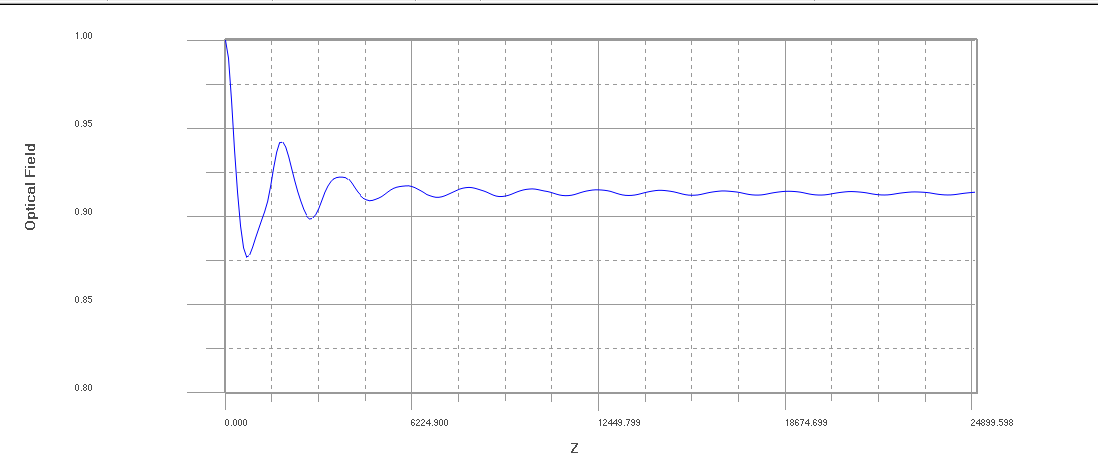
Thanks a lot! I have read that post and now I can understand the definations of Relative Power and Path Monitor.I also understand why it is less than 1 at the input.In my case,the starting field is Mode so I think the “Power in path “ graph should start from the value closing to 1.00 (maybe 0.9 or 0.8).But actually it’s only 0.32 . I just think it’s too little. Is that reasonable?
You are great! Thanks a million!
There is no problem about the 2D simulation.But I still confuse about the 3D simulation.
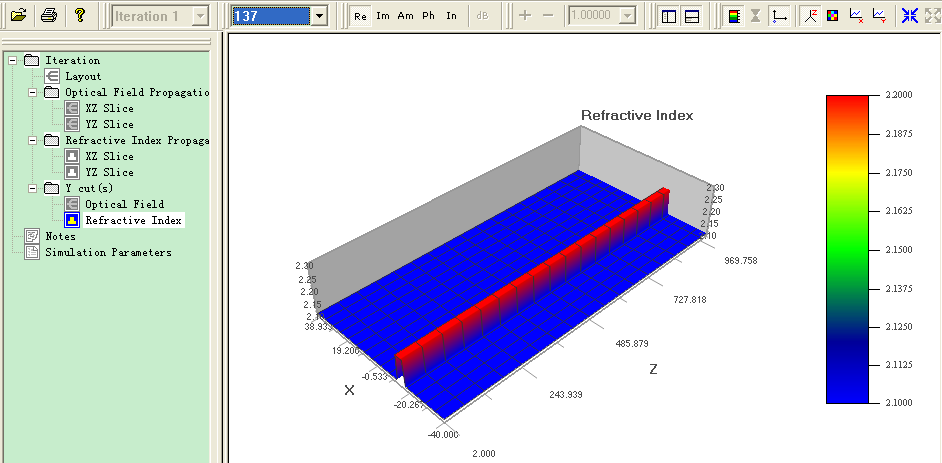
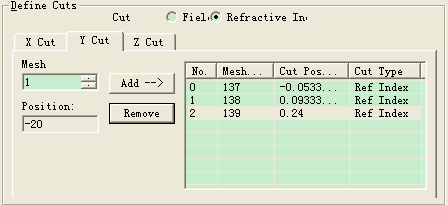
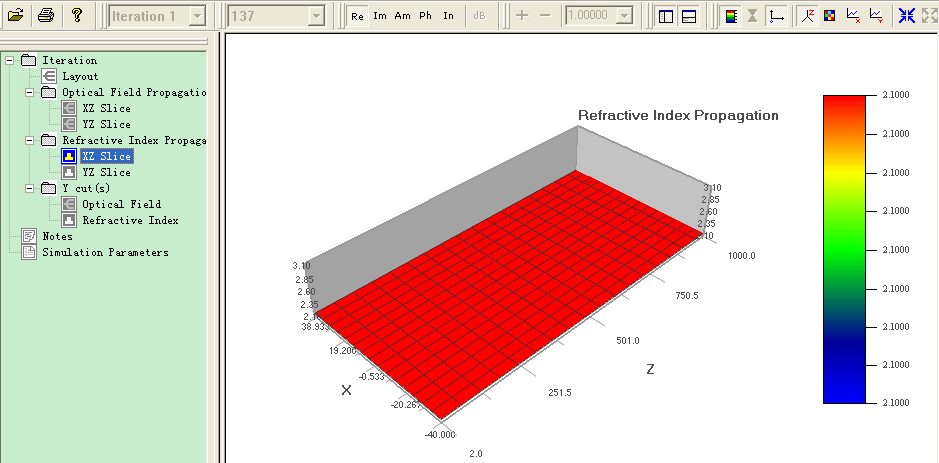
1.I’m not sure the “X-Z slice” graph displays the refractive index distribution in X-Z planar at which y position.(picture 0)
2.Does it display at y=0? If it does,then how can I view the distributions in the x-z planar when y=-1,1,or some other values?
3.I find I can set the Additional Output Data and specify some y cut positions.But I feel it is too troublesome since I just want to view the distribution instead of outputting it.Is there an easier way to achieve that?
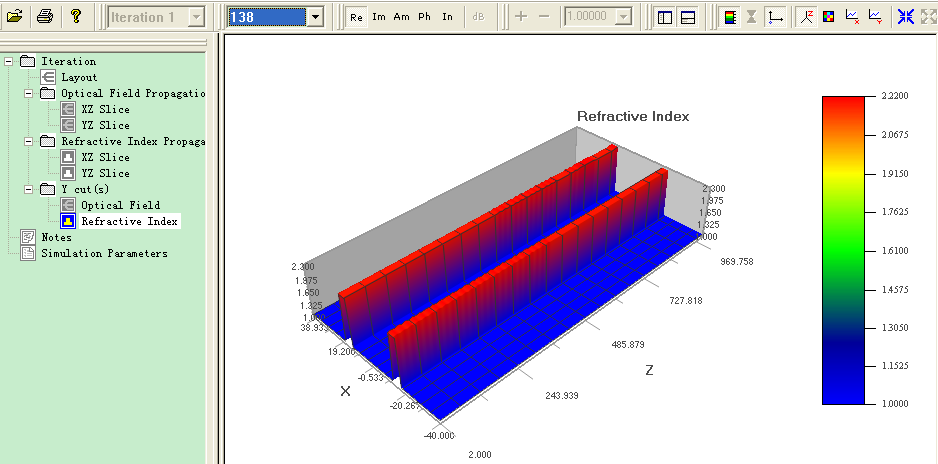
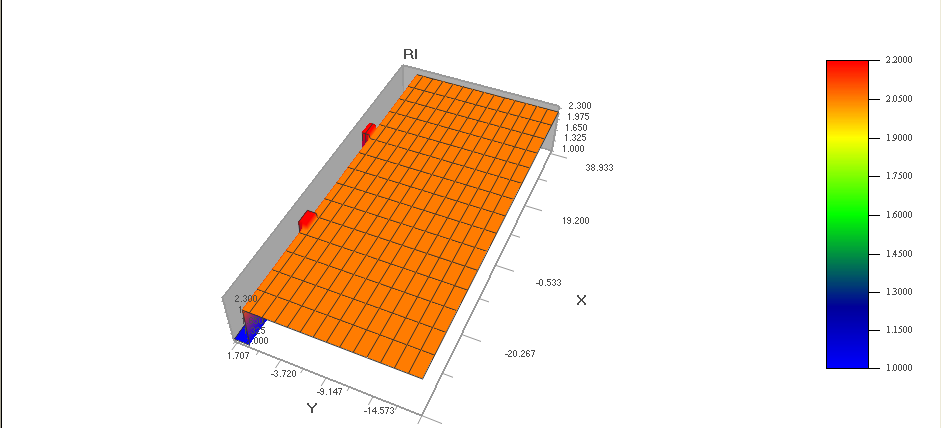
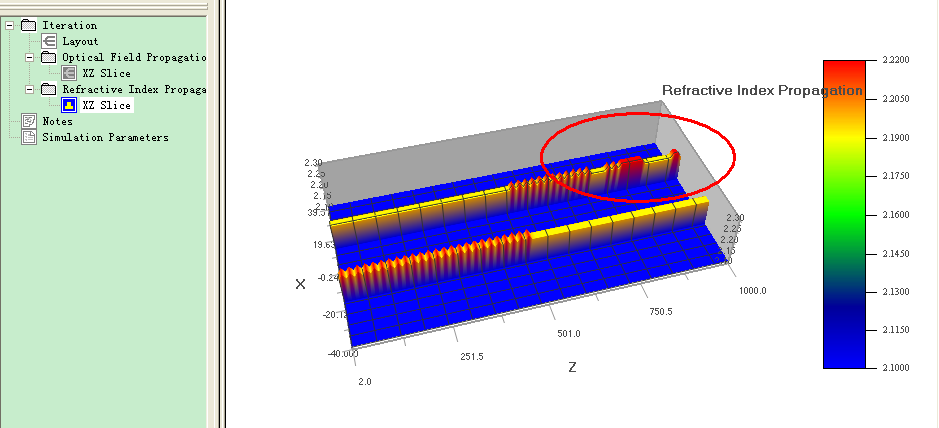
4.Could you please tell me the difference of refractive index between in XZ slice and in Y cut graphs(picture 0 and picture 01,02)?The picture 01 and 02 display what I think is right while the picture 0 I think is strange.
I hope my poor English doesn’t bother you. Thanks again for your attention.
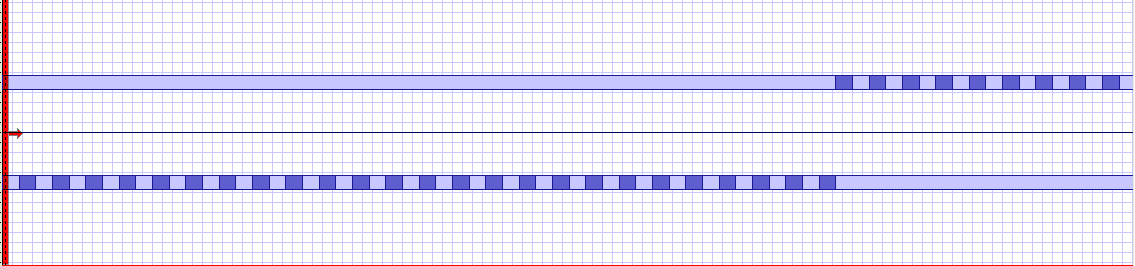
Thanks for your reply.But even if I run the 2D simulation ,the refractive index displayed in the Results Analyzer is different from which in the main layout.You can have a try with the attachment.It’s very weird.
Thank you for your suggestions. Unfortunately,it seems it doesn’t work. I wonder whether the computer system you tested is a complete Chinese system.I mean,is it an English system with a Chinese language package or a system installed by a Chinese Windows XP CD? Results may differ.Even if my system is somehow special,I still confuse why only the optiwave softwares have the problem, while other software like Rsoft displays properly as the attachment shows.