In the same manner, we may analyze the second design. There is no difference between this layout and the first. The simulation time savings are even more evident. Note the empty space occupying the bottom left section of the layout shown in Figure 15.
Figure 15: MZI layout showing subcomponent boundaries
We follow exactly the same procedure as shown before. At this point, we want to point out the possible questionableness of any chosen division criteria. The optical sub- cells like the couplers should cover the entire functionality of the element. The slight difficulty arises with the division of the long curved waveguides marked on the Figure 15 with yellow lines. A user will probably pick the proposed solution marked by the bold lines. However, a potential success of the simulation will depend on the numerical method and/or approach employed for the particular task (e.g. the conformal mapping technique in cases of bent waveguides). This is shown by the thinner lines. Actually, a user is quite free when analyzing such the structure. We see it as an extra flexibility and our already gained experience shows, it really helps to understand the device behavior in every tiny detail.
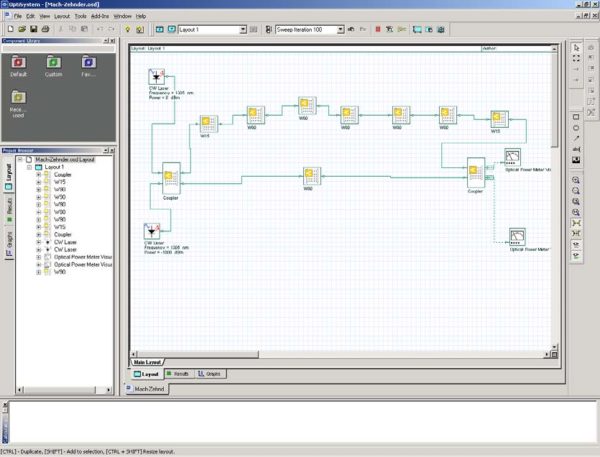
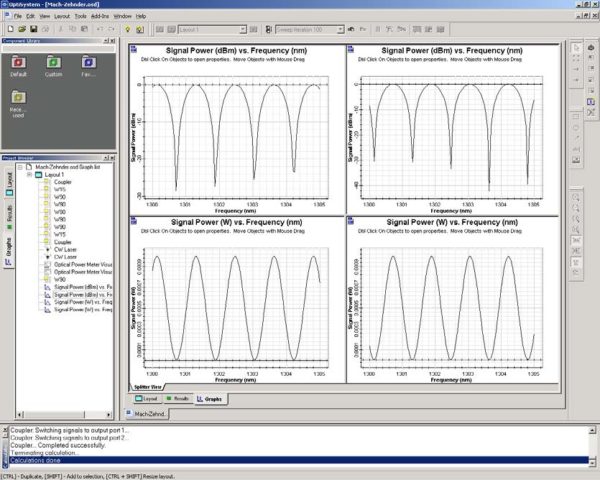
The MZI under the OptiSystem layout is shown on the next schematics (Figure 16 ). The explanation is simple. We have the input and the output couplers and two arms, the lower is characterized by one single bent waveguide, however the upper arm consist of the proper set of curved waveguides (any details are given in the manuals accordingly). The last graphics shows nothing else, but the interference patterns in the both output arms having the well-know shapes.
Figure 16: Mach-Zehnder system schematic in OptiSystem
Figure 17: Signal power vs. Frequency results


