Abstract
Biological cells can be considered as dielectric objects with a given refractive index distribution. Light scattering simulations provide us with an efficient tool for studying cell morphology as well as the nature of scattering and its sources.
The analysis of this information is the basis for a better understanding and development of new optical methods for non-invasive biomedical diagnostics. Here we demonstrate the potential of Finite-Difference Time-Domain (FDTD) method based software tools for the simulation of light scattering from single cells in situations where other approaches simply do not work or the approximations inherited in them begin to be questionable.
Introduction
The application of optical methods in basic biomedical research as well as clinical applications is emerging as one of the new technological paradigms in today’s knowledge based economy. This bio-photonics convergence is due, from one side, to the recent significant advancement of photonics and biotechnologies worldwide and, from another side, to the various health, environment and defense related challenges faced by human society at the beginning of 21-st century.
One of the benefits of the recent heavy investment in photonics research and development was the higher maturity and sophistication of the commercially available advanced photonics design software simulation tools, and of the Photonics Design Automation (PDA) industry in general.
The present tendency towards planar lightwave technology device miniaturization, which inherently includes a much higher physical and fabrication complexity, has contributed to another technological convergence – the use of PDA tools in the life sciences. In the present article we will consider the potential of the Finite-Difference Time Domain (FDTD) approach for studying the light scattering properties of single biological cells.
The FDTD approach
The FDTD method has been established as a powerful tool for micro-photonics device simulations and was already successfully implemented in commercially available advanced photonics software simulation packages.
The popularity of the FDTD method is due to its ability to model a large variety of light propagation phenomena and material effects such as scattering, diffraction, reflection, refraction, absorption, gain and polarization effects. It can also successfully model material anisotropy, dispersion and nonlinearities without any pre-assumptions and approximations for the nature of the optical field and its behavior. The method is extremely well suited for the design and analysis of sub-micron devices with very fine structural details.
The FDTD approach is based on the direct numerical solution of the time dependent Maxwell’s equations. It uses the so-called Yee’s numerical scheme implementing central difference approximations for the numerical derivatives in space and time. The sampling in space is on a sub-wavelength scale. Typically, 10 to 20 steps per wavelength are needed.
The sampling in time is selected to ensure numerical stability of the algorithm. Pulsed or CW excitations of the numerical scheme can be used. In the CW case the optical wave analog propagates until it reaches a stationary state. The basic FDTD algorithm must be modified at the boundaries of the computational domain where suitable numerical absorbing boundary conditions are applied.
This allows for the minimization of the computational domain. When the FDTD simulation is completed the time domain vectorial optical field is saved at the borders of the minimized computational domain. This is the field near to the scattering object. It is of no relevance for a real life experiment where the detector is far away on a distance much larger than the dimensions of the scattering object – the cell. A far field transformation procedure is needed to get the corresponding fields in the far field region.
In photonics, a sub-micron device scale implies a high degree of light confinement and, correspondingly, the necessity for a large refractive index difference of the materials (mostly semiconductors) to be considered. In the simulation and modeling of light scattering from micro-biological structures such as single bio-cells or clusters of cells this necessity does not apply. Micro-biological objects can be considered as complex dielectric objects with a given refractive index value distribution (usually varying in the range3 of 1.3-1.7) and light scattering simulations provide us with an efficient tool for studying the morphology of the objects as well as the nature of scattering and its sources.
The analysis of this information is the basis for a better understanding and development of new optical methods for non-invasive biomedical diagnostics. Our main aim here is to demonstrate the potential of the FDTD approach for the simulation of light scattering from single cells in situations where other approaches simply do not work or the approximations inherited in them begin to be questionable.
Why FDTD
The development of noninvasive optical methods requires a fundamental understanding of how light scatters from structures within tissue. For example, light scattering spectroscopy and optical coherence tomography are directly related to the measurement of light scattering parameters. It is very important to understand from what micro-biological structures light scatters, how sensitive are light scattering parameters to the dynamic changes of these structures as well as, if possible, to quantitatively relate these changes to measured light scattering parameters.
In particular, light scattering from single biological cells and nuclei is currently being under intensive investigation in the scientific and research literature. There is an agreement that the dimensions of scattering centers are below 1 μm and, therefore, much of the scattering must be from small structures within the cells’ nuclei and cytoplasmic organelles. Mitochondria have been recognized as a major source of scattering. Phase contrast microscopy studies show that nuclei and nucleoli cause significant phase shifts compared to other cell components and are also expected to be a major source of light scattering. FDTD simulations of light scattering from cells have significantly contributed to the elucidation of the role of cell morphology on light scattering patterns.
The FDTD approach has demonstrated its unique ability to estimate the accuracy of the currently used analytical and numerical techniques as well as of their approximations. In addition, it provides valuable information about the interaction of light with a single cell. For example, it was found that the overall shape of the nucleus influences small-angle scattering whereas the effects of small intracellular organelles, or high-frequency index of refraction fluctuations, are more evident at higher angles. It was clearly established that scattering patterns change significantly based on the cell’s internal structure, the surrounding environment, and the wavelength of illuminating light. These findings will facilitate the design of more effective optical diagnostic systems by allowing prediction of changes in scattering as a function of cell morphology.
Simulation results
In this article we present the FDTD simulation results based on 2D and 3D dielectric models of the cell. During the simulation process we extract the scattering patterns – the plot of the intensity of scattered light as a function of angle. From a scattering pattern it is relatively easy to estimate the relative magnitude of scattered light power at different angles and compare the results from multiple simulations accounting for particular features of cell’s shape, composition or morphology.
We have intentionally restricted our consideration to simple cell morphologies. Our main focus here is on accounting for the effect of two different factors on the light scattering patterns. First, we consider the effect of absorption in the medium surrounding the cell. Previous studies have shown that accounting for absorption in the host medium influences the light scattering distributions from phytoplankton cells which are of prokaryotic type and do not have a well formed nucleus6. Second, this is the effect of the deviation from the ideal spherical shape of the cell and, in particular, the effect of the elongation of the cell in one of the space dimensions. Previous studies based on the T-matrix method have shown that alignment of red blood cell volume-equivalent spheroids, sphering, and elongation have a significant influence on the angular distribution of the scattered light.
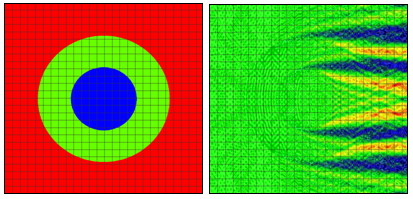
Figure 1: Refractive index (left) and electric near field amplitude (right) distribution around one of the cells in a vertically oriented infinite row of periodically positioned circular cells with a period of 24 μm. The radii of the cell and of the nucleus are 8 μm and 4 um, respectively. Blue and red colors (right) correspond to min and max values of the electric field amplitude. Results and graphs generated by the OptiFDTD software Results Analyzer.
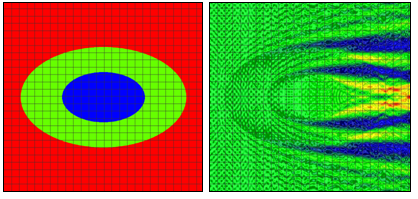
Figure 2: Refractive index (left) and electric near field amplitude (right) distribution around one of the cells in an infinite row of periodically positioned elliptical cells with a period of 24 μm. The longer and shorter cell radii are 10 μm and 6.4 μm, respectively. The longer and shorter nucleus radii are 5 μm and 3.2 μm, respectively.
We will consider first 2D simulation results of a single cell situated in a computational domain with periodic boundary conditions on the two opposite sides along the direction of propagation (top and bottom of the graphs in Fig. 1 and Fig. 2). The refractive indices values are as follows: cytoplasm: 1.37; nucleus: 1.4; extra-cellular medium: 1.35. The near field electric field distribution in this case is equivalent to the case where an infinite vertical row of cells is considered. Comparison of Fig. 1 and Fig. 2 demonstrates the effect of small cell shape variation on the electric near field distribution around the cell. Slight changes of the electric field distribution in the near field will lead to significant field changes in the far field zone and will be detectable in an experiment.
The 3D simulations presented here consider a 2 μm radius spherical cell containing only a cytoplasm (n = 1.37) and a nucleus (n = 1.4, radius 1 μm). The extra-cellular medium has a refractive index value n = 1.35. In our 3D simulations, the dimensions of the cell are intentionally minimized. This significantly relaxes the intensity of the computational efforts. These cell dimensions can be associated with a very small cell or with an inhomogeneous nucleus containing a nucleolus. The emphasis of our study here is on the ability of the FDTD method to model various important features of cell’s morphology and in particular absorption in the extra-cellular medium. To study the effect of the absorption of the extra-cellular medium in 3D we assume that the refractive index value of the extra-cellular medium has a real and an imaginary part: n +iκ.
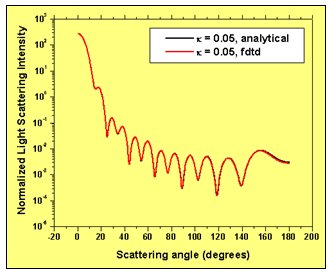
Three cases for the complex value of the extra-cellular refractive index are considered: 1.35+i0.00, 1.35+i 0.01, 1.35+i0.05. The simulation of this particular effect requires the implementation of advanced numerical boundary conditions such as the so-called un-split perfectly matched layer (UPML) boundary conditions2. The 3D FDTD programming code used here6 has UPML boundary conditions. The wavelength of incident light used in the simulations is 900 nm. The space resolution in all direction is equal to 1/30 the wavelength. The time step ensures numerical stability of the algorithm. We have validated our 3D FDTD simulation results by comparing them to the results based on a recently developed analytical technique. Fig. 3 demonstrates the amazing coincidence of the simulated and analytically obtained normalized light scattering patterns in the case where the extra-cellular medium has a refractive index 1.35+i0.005.
Figure 3: FDTD simulation results validation. Normalized light scattering intensity distribution with scattering angle – comparison of simulation and analytical results.
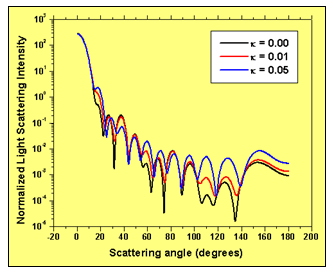
Figure 4: Light scattering intensity with scattering angle for three values of the imaginary part of the refractive index of the extra-cellular medium: a) 0.00; b) 0.01; c) 0.05. Higher absorption in the extra-cellular medium increases the scattering intensity for larger values of the scattering angle.
Fig. 4 shows the normalized light scattering intensity as a function of the scattering angle for three values of the imaginary part of the refractive index of the surrounding host medium: 0.00, 0.01 and 0.05. It is clear that increasing the imaginary refractive index of cell’s surrounding medium significantly modifies the angular distribution of light scattered intensity.
Higher absorption in the extra-cellular medium increases the scattering intensity for larger values of the scattering angle. This fact has to be taken into account when studying the scattering efficiency of biological tissue light scatterers in general. It shows that the analysis of light scattering from isolated biological cells does not necessarily account for the whole effect of the surrounding medium. Considering an effective absorption in the extra-cellular material is more realistic in terms of averaging the global effect of the external light scatterers in the proximity of the cell.
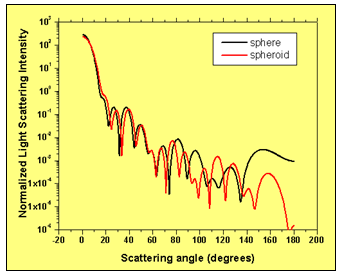
To study the effect of the deviation of the 3D cell shape from the ideal spherical one we compare the light scattering patterns from a cell with the parameters given above situated in a lossless medium with the scattering pattern from a cell having the same volume but a radius in the Z direction equal to 2.5 μm. This corresponds to a radius in the X and Y directions equal to 1.789 μm.
We also assume that the nucleus of the cell is deviating from the ideal spherical shape proportionally. The light is incident along the long radius of the particle. Fig. 5 compares the light scattering patterns of an ideal spherical cell and a spheroid shaped cell with the parameters given above. The comparison shows that slight deviations in cell’s shape modify the light scattering pattern for larger values of the scattering angle.
Figure 5: Comparison of the light scattering intensity distribution of an ideal spherical cell and a spheroid shaped cell having the same volume.
Conclusion
We have discussed and demonstrated the power of the FDTD approach for the investigation of the light-scattering properties of biological cells. The method places no limitations on the geometry or refractive index distribution of the biological cells and has no inherent approximations for the type and the behavior of the optical field. It was demonstrated that relatively small changes of cell shape or the parameters of the extra-cellular medium can significantly change the angular distribution of the scattered light.
The successful application of the FDTD technique requires an adequate knowledge about cellular dielectric structure and parameters however it is also one of the powerful tools for building up a deeper understanding about them and a better understanding of existing and new optical methods for non-invasive biomedical diagnostics.


