Our Analyzer provides a number of tools allowing for evaluation simulation results.
Observation Point
| Step | Action |
| 1 | Select “Observation Area Analysis” under the “Tools” menu in the Analyzer.
Observation Point dialog box appears |
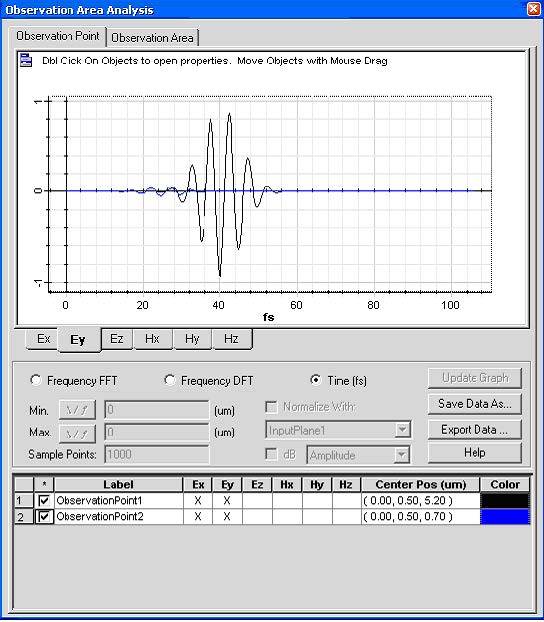
| 2 | To observe the time domain response in the observation point, check the observation point object, select the field components button, and select Time radio button. (See Figure 9) |
Figure 9: Time domain response in observation point
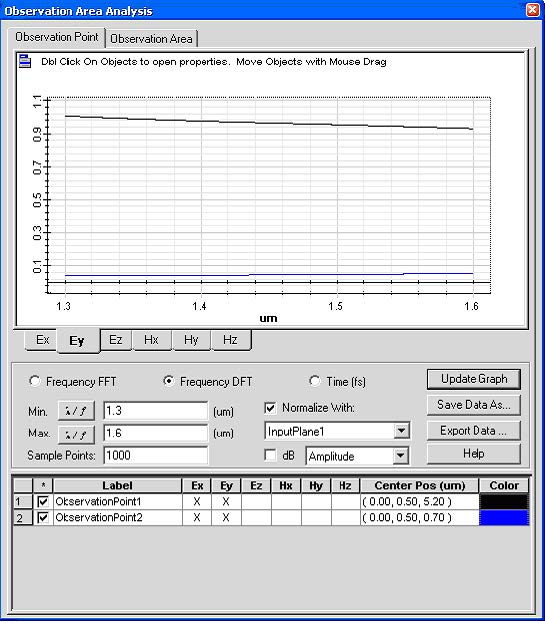
| 3 | To get the transmission /reflection function response in an observation point, select Frequency FDT radio button. And type the following values (See Figure 10)
Minimum wavelength: 1.3 Maximum wavelength: 1.6 Sample point: 1000 Normalize with: InputPlane1 Click Update Graph button |
Figure 10: Transmission/Reflection function based on Observation point
Field pattern in Observation Area
| Step | Action |
| 1 | Select Observation Area in Observation Area Analysis dialog box. |
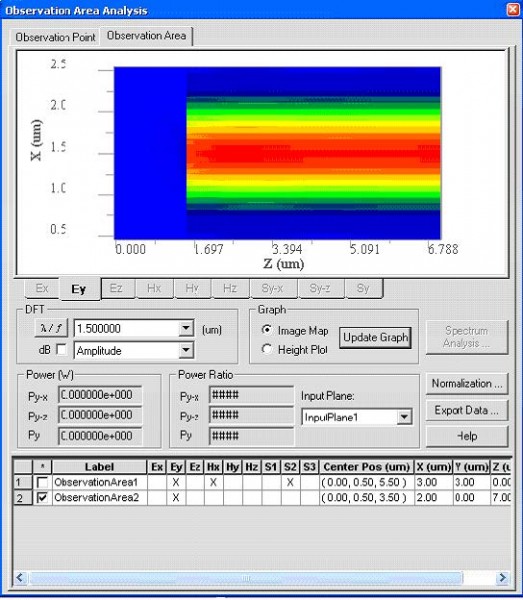
| 2 | Select “ObservationArea2” in the observation area check list |
| 3 | Select wavelength 1.5 from the l/f list box
Note: • Click l/f button to alternate the unit between wavelength and frequency • The wavelength or frequency value is pre-set in the spectrum setting dialog box (refer to Figure 2) |
| 4 | Click Update Graph (see Figure 11) |
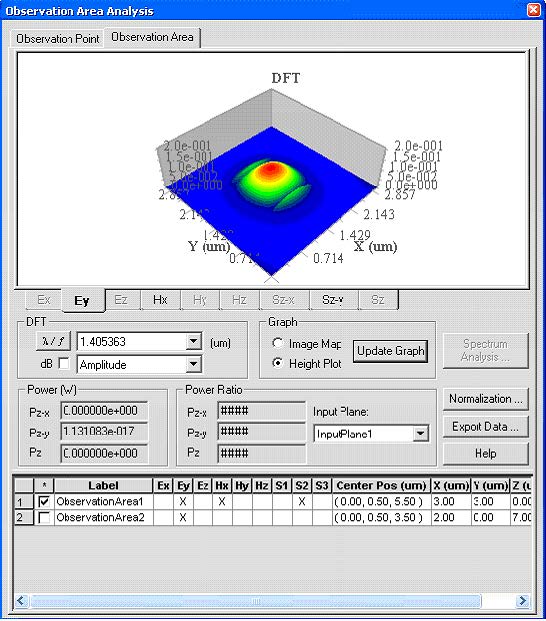
| 5 | Repeat step 2 to step 4 for ObservationArea1 (See Figure 12) |
Figure 11: Field pattern in Observation area 2
Figure 12: Field pattern in Observation area 1
Power transmission/reflection function
| Step | Action |
| 1 | Select Observation Area in Observation Area Analysis dialog box. |
| 2 | Select “ObservationArea2” in the observation area check list |
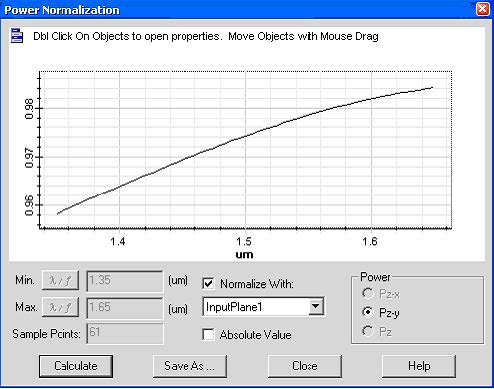
| 3 | Select Power Spectrum button, Power Spectrum dialog box appears |
| 4 | Check “normalize with” checkbox and click Calculate button, Power Transmission spectrum appears, (refer to Figure 13) |
Figure 13: Power transmission spectrum
Note:
• In order to perform power calculations, the necessary field components have to be selected for different polarization power.
• When an observation area is behind the input wave, it can detect the reflection power spectrum.


