| Step | Action |
| 1 | Re-open this layout in the OptiFDTD Designer. |
| 2 | Select “Elliptic Waveguide” under the Draw menu, or select the Elliptic Waveguide in the shortcut toolbar. |
| 3 | Left-click and do not release the mouse to draw an elliptic waveguide in the layout. release the mouse by clicking the arrow toolbar. |
| 4 | To adjust the position and the shape of the elliptic waveguide, in the layout window, double-click the Elliptical Waveguide. The Elliptic Waveguide Properties dialog box appears. |
| 5 | In the Elliptic Waveguide Properties dialog box, input following information
• Horizontal Offset: 1.0µm • Vertical Offset: 0.0µm • Major Radius Offset: 0.15µm • Minor Radius Offset: 0.15 µm • Orientation Angle offset: 0 • Channel Thickness Tapering : User default • Depth: 0.0µm • Label;’Elliptic1 • ProfileChannelPro1 |
| 6 | Click OK in the Elliptic Waveguide Properties dialog box, the elliptic waveguide appears inside the TFSF region center. (Figure 16) |
Figure 16: Elliptic waveguide in the TFSF region
| 7 | Click Save as in the file menu to save this project to another file name. |
| 8 | Click Run in the 2D 32bit simulation parameter dialog box to start the simulation. |
| 9 | After the simulation, start the analyzer. |
| 10 | In the analyzer, Click Observation Area Analysis under the tools menu, Observation area analysis dialog box appears. |
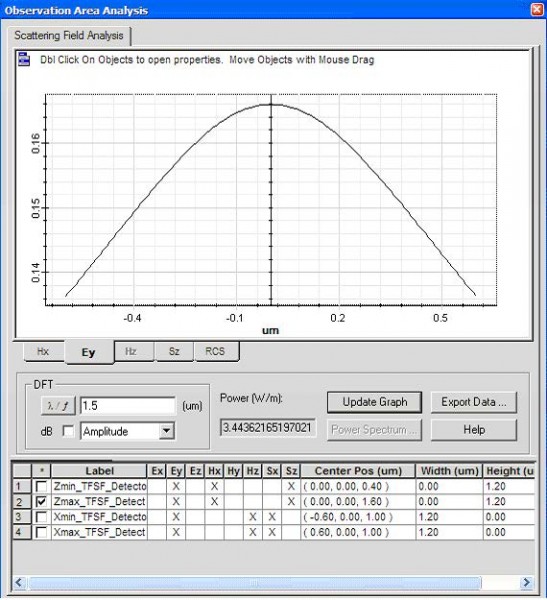
| 11 | Click Scattering Field Analysis tab in the Observation Area Analysis dialog box, four Scattering Field(SF) detector is listed in this dialog box, select one of them, select the field components tab. then click update graph, the pure scattering field will be displayed. (Figure 17). |
Figure 17: Scattering field
| 12 | Click RCS (Radar Cross Section) tab, the input the following information (default value)
• Start angle: 0o • End Angle: 360o • Sampling Point Count: 361 • Far field Distance: 10, 000* wavelength Note: • For single wavelength simulation, by default Wavelength is the center wavelength • For Gaussian Modulated Continuous Wave (GMCW), user can input new wavelength. • RCS far-field formula is explained in the technical background. |
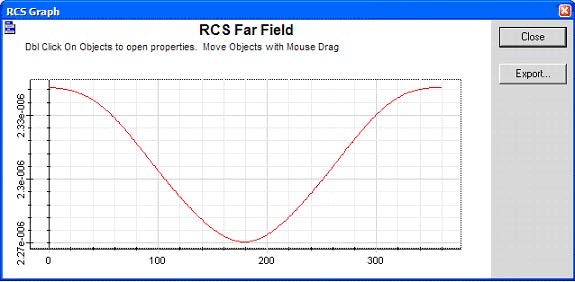
| 13 | Click Calculate in the RCS tab page, RCS results will be displayed (Figure 10) |
Figure 18: RCS results
Note:
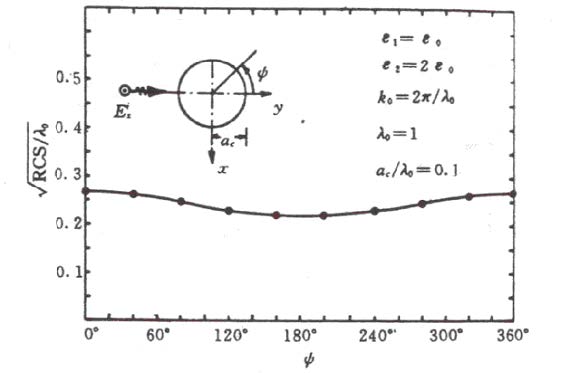
• The above RCS results agreed with the results in the reference [1] as shown below (Figure 11)
Figure 19: RCS results in reference
• Click Export in RCS results dialog box can store the results to a file, RCS results file is an text file, the first three line is file header, the remaining first column is the angle, the second column is the far-field amplitude.


